 |
The earliest tables of ΔT values were drawn up by Willem de Sitter (192?) and Dirk Brouwer (1952). The underlying observations (mainly of stellar occultations by the Moon) were reduced with the lunar theory of E.W. Brown in which a lunar (or tidal) acceleration parameter (n') of –22.44 "/cy/cy was adopted, based on the earlier studies of Spencer Jones (1939). A re-analysis of all the available observations between 1627 and 1860 by Charles F. Martin (1969) led to an improved set of ΔT values for this period.
The data of Brouwer and Martin was re-analysed by L.V. Morrison (1979), who further extended the range from 1620 to 19?? and reduced them using a lunar acceleration parameter of –26.0 "/cy/cy, based on the studies of Morrison & Ward (1975).
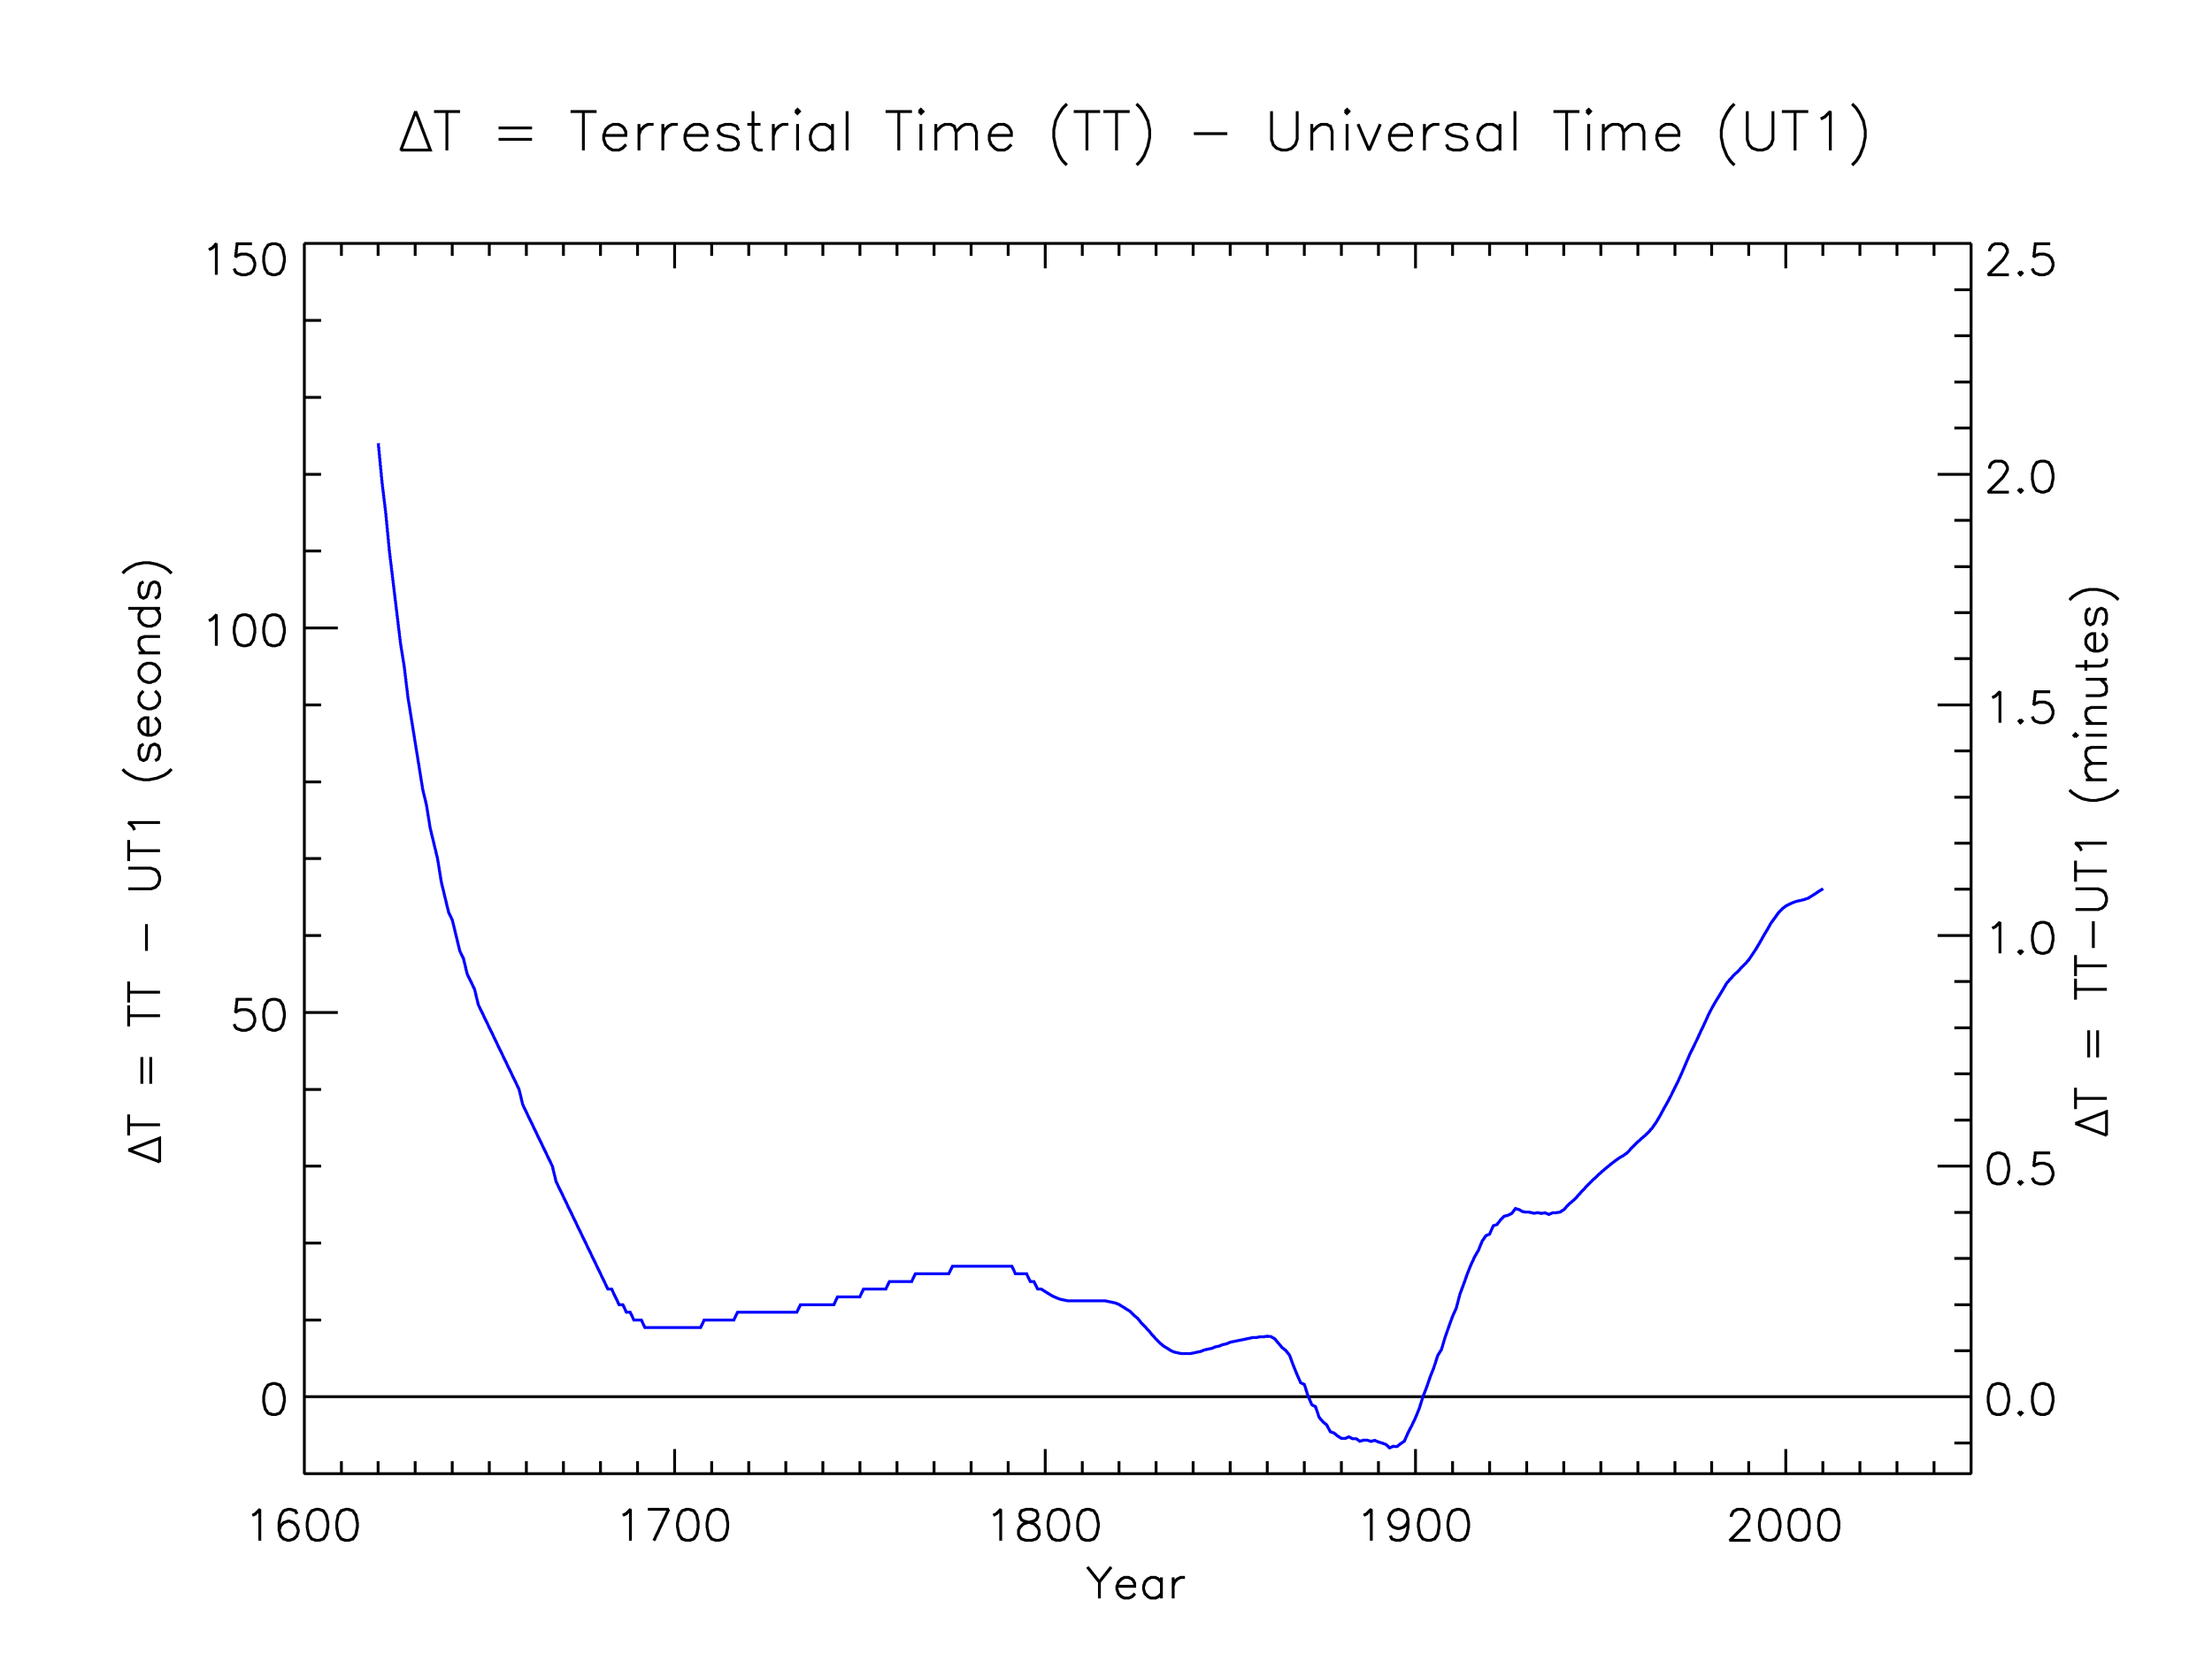
The values listed in the following table for the historical period (about up to 19??) are based on the analysis of F.R. Stephenson & L.V. Morrison (1984) of the times of stellar occultations of the Moon, solar eclipses and transits of the planet Mercury across the solar disk. The values for the more recent past are mainly derived from Very Long Baseline (VLB) observations of bright radio point sources such as quasars and radio stars.
| year | +0 | +1 | +2 | +3 | +4 | +5 | +6 | +7 | +8 | +9 |
| 1620 | 124 | 119 | 115 | 110 | 106 | 102 | 98 | 95 | 91 | 88 |
| 1630 | 85 | 82 | 79 | 77 | 74 | 72 | 70 | 67 | 65 | 63 |
| 1640 | 62 | 60 | 58 | 57 | 55 | 54 | 53 | 51 | 50 | 49 |
| 1650 | 48 | 47 | 46 | 45 | 44 | 43 | 42 | 41 | 40 | 38 |
| 1660 | 37 | 36 | 35 | 34 | 33 | 32 | 31 | 30 | 28 | 27 |
| 1670 | 26 | 25 | 24 | 23 | 22 | 21 | 20 | 19 | 18 | 17 |
| 1680 | 16 | 15 | 14 | 14 | 13 | 12 | 12 | 11 | 11 | 10 |
| 1690 | 10 | 10 | 9 | 9 | 9 | 9 | 9 | 9 | 9 | 9 |
| 1700 | 9 | 9 | 9 | 9 | 9 | 9 | 9 | 9 | 10 | 10 |
| 1710 | 10 | 10 | 10 | 10 | 10 | 10 | 10 | 11 | 11 | 11 |
| 1720 | 11 | 11 | 11 | 11 | 11 | 11 | 11 | 11 | 11 | 11 |
| 1730 | 11 | 11 | 11 | 11 | 12 | 12 | 12 | 12 | 12 | 12 |
| 1740 | 12 | 12 | 12 | 12 | 13 | 13 | 13 | 13 | 13 | 13 |
| 1750 | 13 | 14 | 14 | 14 | 14 | 14 | 14 | 14 | 15 | 15 |
| 1760 | 15 | 15 | 15 | 15 | 15 | 16 | 16 | 16 | 16 | 16 |
| 1770 | 16 | 16 | 16 | 16 | 16 | 17 | 17 | 17 | 17 | 17 |
| 1780 | 17 | 17 | 17 | 17 | 17 | 17 | 17 | 17 | 17 | 17 |
| 1790 | 17 | 17 | 16 | 16 | 16 | 16 | 15 | 15 | 14 | 14 |
| 1800 | 13.7 | 13.4 | 13.1 | 12.9 | 12.7 | 12.6 | 12.5 | 12.5 | 12.5 | 12.5 |
| 1810 | 12.5 | 12.5 | 12.5 | 12.5 | 12.5 | 12.5 | 12.5 | 12.4 | 12.3 | 12.2 |
| 1820 | 12.0 | 11.7 | 11.4 | 11.1 | 10.6 | 10.2 | 9.6 | 9.1 | 8.6 | 8.0 |
| 1830 | 7.5 | 7.0 | 6.6 | 6.3 | 6.0 | 5.8 | 5.7 | 5.6 | 5.6 | 5.6 |
| 1840 | 5.7 | 5.8 | 5.9 | 6.1 | 6.2 | 6.3 | 6.5 | 6.6 | 6.8 | 6.9 |
| 1850 | 7.1 | 7.2 | 7.3 | 7.4 | 7.5 | 7.6 | 7.7 | 7.7 | 7.8 | 7.8 |
| 1860 | 7.88 | 7.82 | 7.54 | 6.97 | 6.40 | 6.02 | 5.41 | 4.10 | 2.92 | 1.82 |
| 1870 | 1.61 | 0.10 | –1.02 | –1.28 | –2.69 | –3.24 | –3.64 | –4.54 | –4.71 | –5.11 |
| 1880 | –5.40 | –5.42 | –5.20 | –5.46 | –5.46 | –5.79 | –5.63 | –5.64 | –5.80 | –5.66 |
| 1890 | –5.87 | –6.01 | –6.19 | –6.64 | –6.44 | –6.47 | –6.09 | –5.76 | –4.66 | –3.74 |
| 1900 | –2.72 | –1.54 | –0.02 | 1.24 | 2.64 | 3.86 | 5.37 | 6.14 | 7.75 | 9.13 |
| 1910 | 10.46 | 11.53 | 13.36 | 14.65 | 16.01 | 17.20 | 18.24 | 19.06 | 20.25 | 20.95 |
| 1920 | 21.16 | 22.25 | 22.41 | 23.03 | 23.49 | 23.62 | 23.86 | 24.49 | 24.34 | 24.08 |
| 1930 | 24.02 | 24.00 | 23.87 | 23.95 | 23.86 | 23.93 | 23.73 | 23.92 | 23.96 | 24.02 |
| 1940 | 24.33 | 24.83 | 25.30 | 25.70 | 26.24 | 26.77 | 27.28 | 27.78 | 28.25 | 28.71 |
| 1950 | 29.15 | 29.57 | 29.97 | 30.36 | 30.72 | 31.07 | 31.35 | 31.68 | 32.18 | 32.68 |
| 1960 | 33.15 | 33.59 | 34.00 | 34.47 | 35.03 | 35.73 | 36.54 | 37.43 | 38.29 | 39.20 |
| 1970 | 40.18 | 41.17 | 42.23 | 43.37 | 44.49 | 45.48 | 46.46 | 47.52 | 48.53 | 49.59 |
| 1980 | 50.54 | 51.38 | 52.17 | 52.96 | 53.79 | 54.34 | 54.87 | 55.32 | 55.82 | 56.30 |
| 1990 | 56.86 | 57.57 | 58.31 | 59.12 | 59.99 | 60.78 | 61.63 | 62.30 | 62.97 | 63.47 |
| 2000 | 63.83 | 64.09 | 64.30 | 64.47 | 64.57 | 64.69 | 64.85 | 65.15 | 65.46 | 65.78 |
| 2010 | 66.07 | 67.1(8) | 68(1) | 68(2) | 69(2) | 69(3) | 70(4) | 70(4) | – | – |
| year | +0 | +1 | +2 | +3 | +4 | +5 | +6 | +7 | +8 | +9 |
| values in light blue are predicted values (with estimated error in the last decimal) | ||||||||||
From 1973 onwards, precise daily values of ΔT can be obtained from the list of UT1–UTC values maintained by the Earth Orientation Department of the US Naval Observatory (view the readme file for more details). ΔT can be obtained from these values from the relation:
ΔT(s) = TAI–UT1 + 32.184 sec = (TAI–UTC) – (UT1–UTC) + 32.184 sec
where (TAI–UTC) is the cumulative number of leap seconds introduced since 1972.
Provisional daily ΔT values for the next 360 days can be obtained in a similar way from the predicted UT1–UTC values listed in the IERS Bulletin A issued bi-monthly by the Earth Orientation Department of the US Naval Observatory.
The above table is also printed and updated each year in the Astronomical Almanac (pages K8-K9), published annually by the Nautical Almanac Offices of the US Naval Observatory (Washington) and the Rutherford Appleton Laboratory (Cambridge). Click here for an ASCII version of the above list. A nearly identical table, in half-yearly intervals from 1657.0 to 1984.5, was published by McCarthy & Babcock (1986).
Note that the values before the mid 1950’s are mainly based on observations of stellar occultations by the Moon that were reduced with Brown’s lunar theory with an adopted lunar acceleration parameter (n') of –26.0 "/cy/cy. For other values of the lunar acceleration parameter, the values listed above before 1955.5 should be corrected by:
ΔT (s) = ΔT (table) – 0.91072 (n' + 26.0) u2
with u = (year – 1955.5)/100, or the time measured in centuries since 1 July 1955.
Values after 1955.5 remain unchanged as they were obtained from observations that were compared directly against International Atomic Time (TAI).
|
Several polynomial representations for the ΔT values of the last few centuries have been proposed in the recent past to obviate the need of incorporating lengthy tables in a computer program. However, in order to account for the irregular fluctuations in the observed ΔT curve, these polynomial fits are of a high order with a necessarily limited range of validity.
Jean Meeus, in the second edition of his Astronomical Algorithms (1998), gives a 12th-order polynomial valid for the time span 1800 to 1997 with a maximum error of 2.3 seconds and two lower-order polynomials covering the same time span with a maximum error of 0.9 seconds. The two latter polynomials are:
| ΔT(s) = | –2.50 + 228.95 u + 5218.61 u2
+ 56282.84 u3
+ 324011.78 u4
+ 1061660.75 u5 + 2087298.89 u6 + 2513807.78 u7 + 1818961.41 u8 + 727058.63 u9 + 123563.95 u10 |
(1800 < year < 1900) |
and
| ΔT(s) = | –2.44 + 87.24 u + 815.20 u2
– 2637.80 u3
– 18756.33 u4
+ 124906.15 u5 – 303191.19 u6 + 372919.88 u7 – 232424.66 u8 + 58353.42 u9 |
(1900 < year < 1997) |
with u = (year – 1900)/100, or the time in centuries since 1900.
These equations replace earlier and less precise polynomial fits valid for smaller time spans given in Schmadel & Zech (1979, 1988), in Montenbruck’s Practical Ephemeris Calculations (1989) and in Montenbruck & Pfleger’s Astronomy on the Personal Computer (1990, 1994, 199?).
The fourth edition of Montenbruck & Pfleger’s Astronomy on the Personal Computer (2000) provides the following 3rd-order polynomials valid for the period between 1825 and 2000 with a typical 1-second accuracy:
| Period | ΔT (s) | u = |
| 1825 to 1850 | +10.4 – 80.8 u + 413.9 u2 – 572.3 u3 | (year – 1825)/100 |
| 1850 to 1875 | +6.6 + 46.3 u – 358.4 u2 + 18.8 u3 | (year – 1850)/100 |
| 1875 to 1900 | –3.9 – 10.8 u – 166.2 u2 + 867.4 u3 | (year – 1875)/100 |
| 1900 to 1925 | –2.6 + 114.1 u + 327.5 u2 – 1467.4 u3 | (year – 1900)/100 |
| 1925 to 1950 | +24.2 – 6.3 u – 8.2 u2 + 483.4 u3 | (year – 1925)/100 |
| 1950 to 1975 | +29.3 + 32.5 u – 3.8 u2 + 550.7 u3 | (year – 1950)/100 |
| 1975 to 2000 | +45.3 + 130.5 u – 570.5 u2 + 1516.7 u3 | (year – 1975)/100 |
Edward M. Reingold & Nachum Dershowitz adopt the following approximate relations in the second edition of Calendrical Calculations (2001) and in their Calendrical Tabulations (2002).
| Period | ΔT (d) | u = |
| 1620 to 1799 | (196.58333 – 406.75 u + 219.167 u2)/86400 | (year – 1600)/100 |
| 1800 to 1899 | –0.000009 + 0.003844 u + 0.083563
u2
+ 0.865736 u3 + 4.867575 u4
+ 15.845535 u5 + 31.332267 u6 + 38.291999 u7 + 28.316289 u8 + 11.636204 u9 + 2.043794 u10 |
(year – 1900)/100 |
| 1900 to 1987 | –0.00002 + 0.000297 u + 0.025184
u2
– 0.181133 u3 + 0.553040 u4
– 0.861938 u5 + 0.677066 u6 – 0.212591 u7 |
|
| 1987 to 2019 | (100 u)/86400 | (year – 1933)/100 |
| otherwise | (–15 + 32.5 u2)/86400 | (year – 1810)/100 |