Measurements of MCF
Since 1978, MCF has been monitored at 5 remote atmospheric stations within
the
ALE/GAGE/AGAGE program (ALE=atmospheric lifetime experiment, black in the figures;
GAGE= global atmospheric
gases experiment, blue in the figures; AGAGE, advanced global atmospheric gases
experiment, green in the figures).
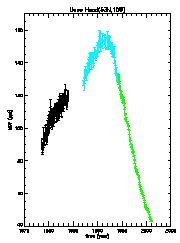
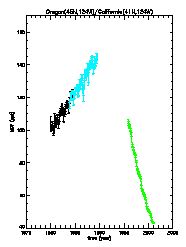
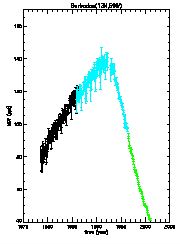
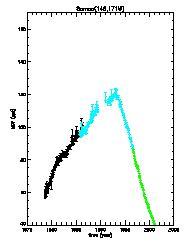
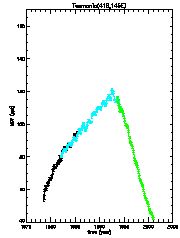
Figures: Monthly mean MCF concentrations in parts per trillion (ppt) as
a function of time. The vertical bars represent the standard deviation
during the month. Black: ALE, blue: GAGE, green: AGAGE. From left to right:
Mace
Head, Oregon, Barbados, Samoa, and Tasmania (see Prinn
et al., 2000).
Inspection of the ALE/GAGE/AGAGE MCF measurements reveals that
- The MCF concentrations were higher on the northern hemisphere (NH) than
on the southern hemisphere (SH) up to the late 1990s
- The variability (the vertical bars represent the standard deviation during
the month) before the late 1990s was higher on the NH than on the SH.
- The concentrations follow the global
emissions closely, but with a delay that corresponds to the tropospheric
lifetime (which is about 5 years).
- Recent years show the lowest concentrations close to the tropics, which
corresponds to low emissions, and breakdown of MCF by OH. Breakdown of MCF
is favored when the temperatures are high, and the OH
concentrations are
high.
Apart from the ALE/GAGE/AGAGE measurements, other observations confirm the
global MCF distribution and the changes in this distribution during the 1990s
(see Montzka et al., 2000).
References
-
Prinn, R. G. et al. A history of chemically and radiatively important gases
in air deduced from ALE/
GAGE/AGAGE. J. Geophys. Res. 105, 17751–17792 (2000)
-
Singh, H. B. Preliminary estimation of average tropospheric HO concentrations
in the Northern and
Southern Hemisphere. Geophys. Res. Lett. 4, 453–456 (1977)
-
Prinn, R. G. et al. Atmospheric trends in methylchloroform and the global
average for the hydroxyl
radical. Science 238, 935–950 (1987)
-
Prinn, R. G. et al. Atmospheric
trends and lifetime of CH3CCl3 and global OH concentrations. Science
269, 187–192 (1995)
-
Prinn, R. G. et al. Evidence for substantial variations
of atmospheric hydroxyl radicals in the past two
decades. Science 229, 1882–1888 (2001)
-
Krol, M., van Leeuwen, P. J. & Lelieveld,
J. Global OH trend inferred from methylchloroform
measurements. J. Geophys. Res. 103, 10697–10711 (1998)
-
Krol, M. & Lelieveld,
J. Can the variability in tropospheric OH be deduced from measurements
of
1,1,1-trichloroethane (methyl chloroform)? J. Geophys. Res. (accepted for publication, pdf)
-
Montzka, S. A. et al. New observational constraints for atmospheric hydroxyl
on global and
hemispheric scales. Science 288, 500–503 (2000)
-
Krol, M., van Leeuwen,
P. J. & Lelieveld, J. Comment on “Global
OH trend inferred from
methylchloroform measurements” by Maarten Krol et al.– Reply. J.
Geophys. Res. 106, 23159–23164
(2001)


