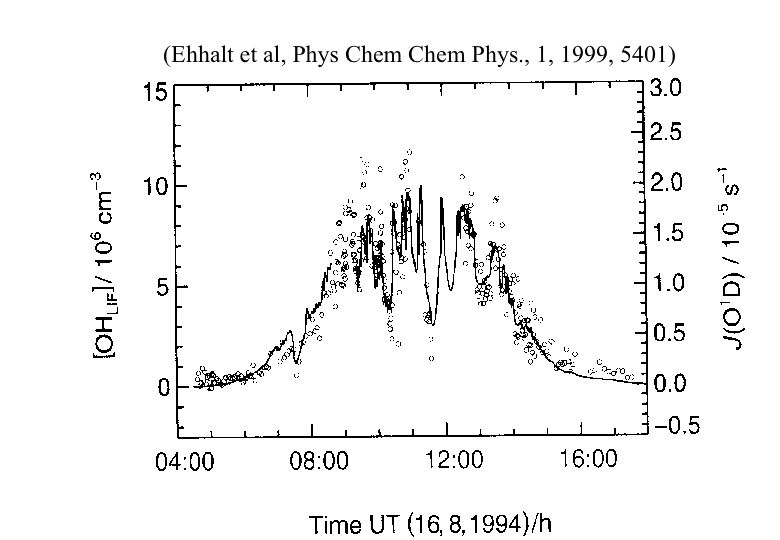
Since the lifetime of OH is very short, the temporal and spatial variability is large (see figure a). The production of OH is governed by solar radiation, ozone and water vapor, which are all very variable in the atmosphere.

Figure a: Photolysis rate of O3 (solid) and OH concentration (open circles) measured by laser induced fluorescence (LIF) as a function of time of day. The ozone photolysis rate varies as a function of e.g. cloud cover. Clearly, the OH concentrations follow the variations in the ozone photolysis rate.
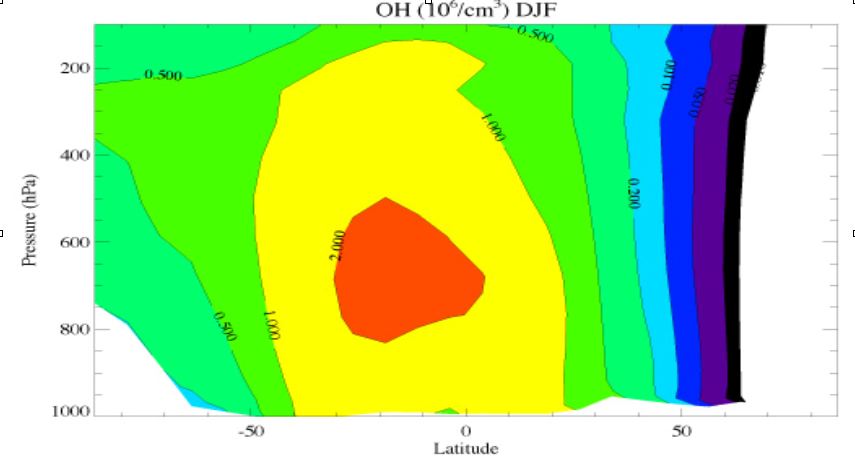
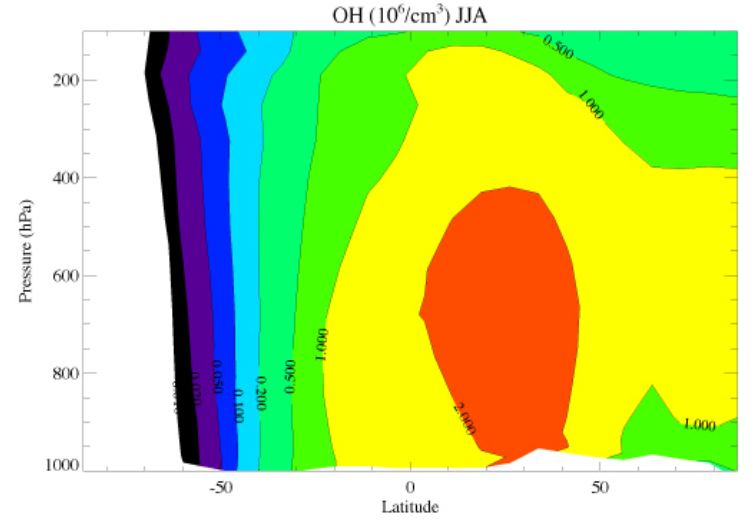
The highest concentrations of OH are expected in the lower tropical troposphere, since this is the region where solar radiation is intense, and water vapor levels are high (warm air may contain much more water vapor than cold air). When solar light is not available, OH levels are much lower. Models can be used to estimate the global distribution of OH. It remains important to realise that models are limited in temporal and spatial resolution. Many processes (e.g. the important variability in ozone photolysis, see figure a) are heavily parameterised.

Figure b : Zonally and 3-monthly (December, January, February) averaged OH concentration. The vertical axis denotes the atmospheric pressure (hPa) and the horizontal axis the latitude. The OH concentrations have been calculated with a chemistry transport model. In such a model, the relevant processes for formation and desctruction of OH are included.

Figure c : Zonally and 3-monthly (June, July, August) averaged OH concentration. See caption figure b.