Here a selection of the results is given, focusing on the conditions at the glacier surface and on the phenomenology of the glacier microclimate.
|
|
|
|
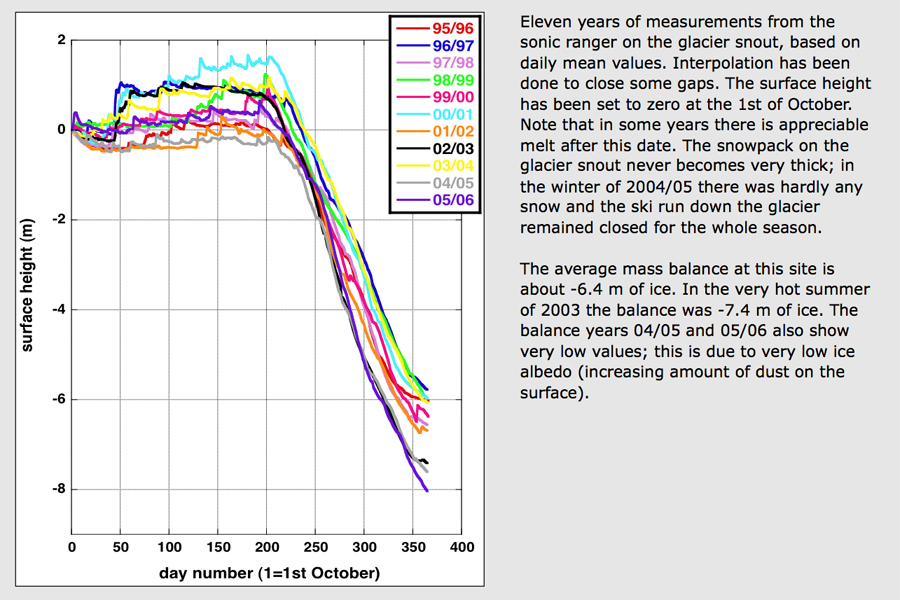
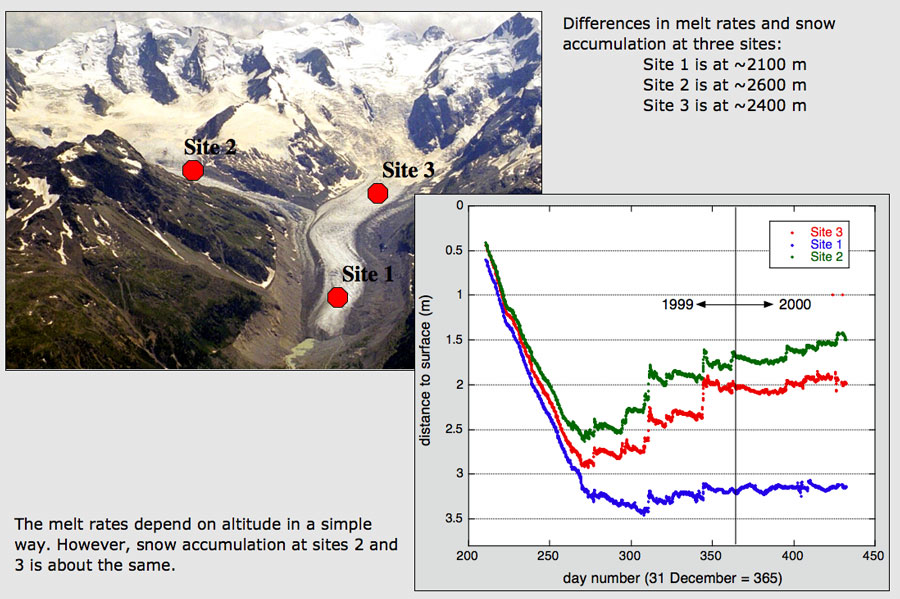
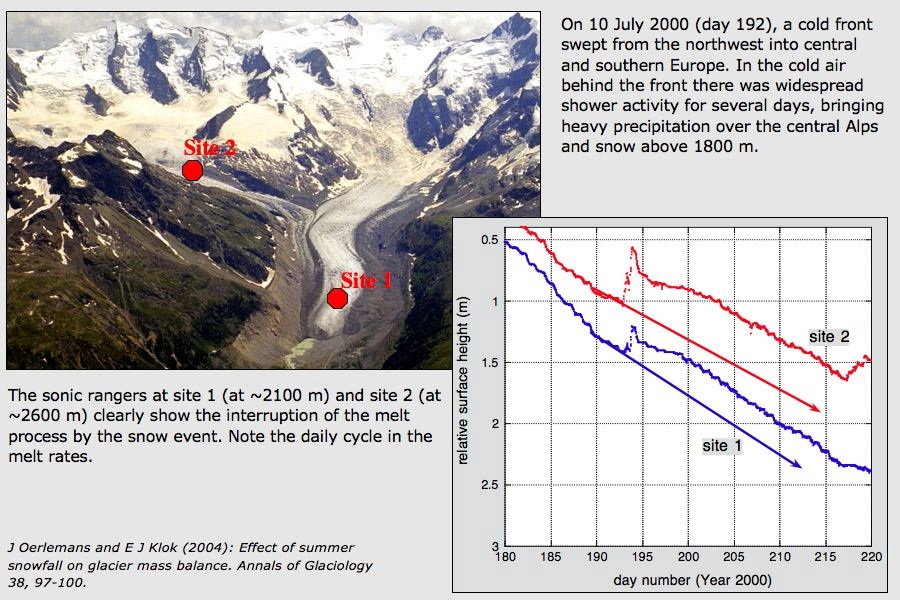
| A 11-year record of measurements from the sonic ranger on the glacier snout, revealing snow depth and ice melt. | Ablation and snow accumulation measured with a sonic ranger at three sites. | Summer snowfall has a significant effect on the mass balance. The strongest recorded event of this kind was on 10/11 July 2000.
|
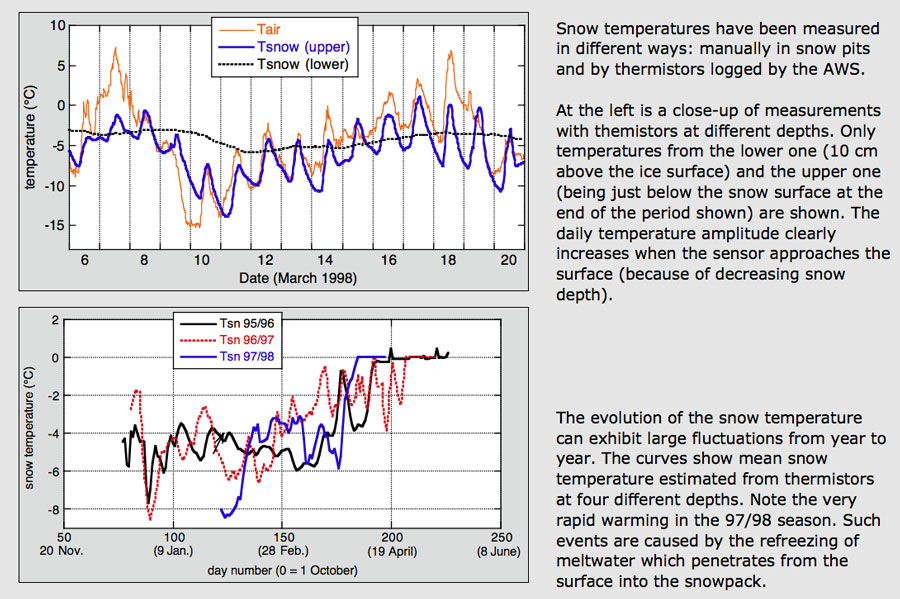
In winter, when the snowpack has reached an appreciable depth, thermistors are placed to measure snow temperature. |
|
|
|
|
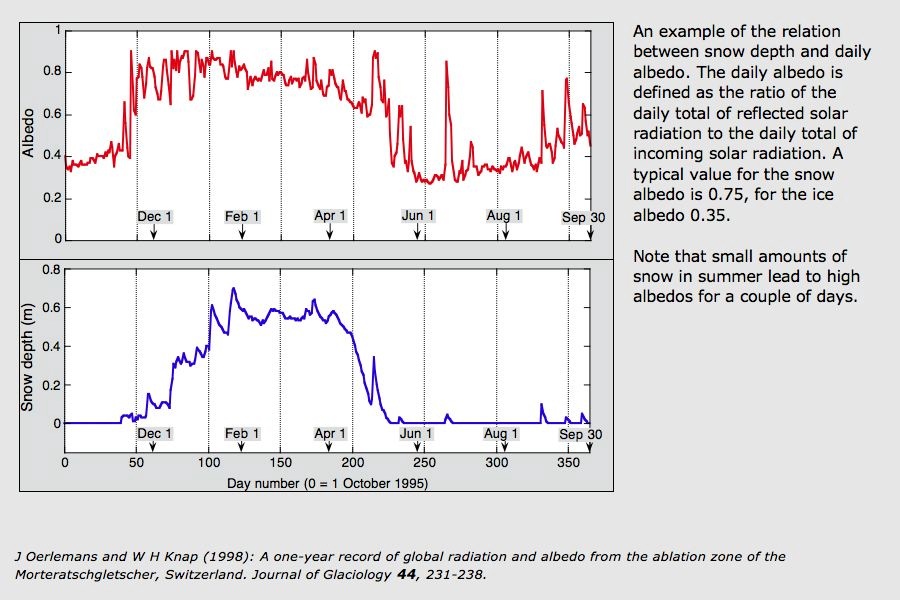
| An example of the relation between snow depth and daily albedo. A typical value for the snow albedo is 0.75, for the ice albedo 0.35.
|
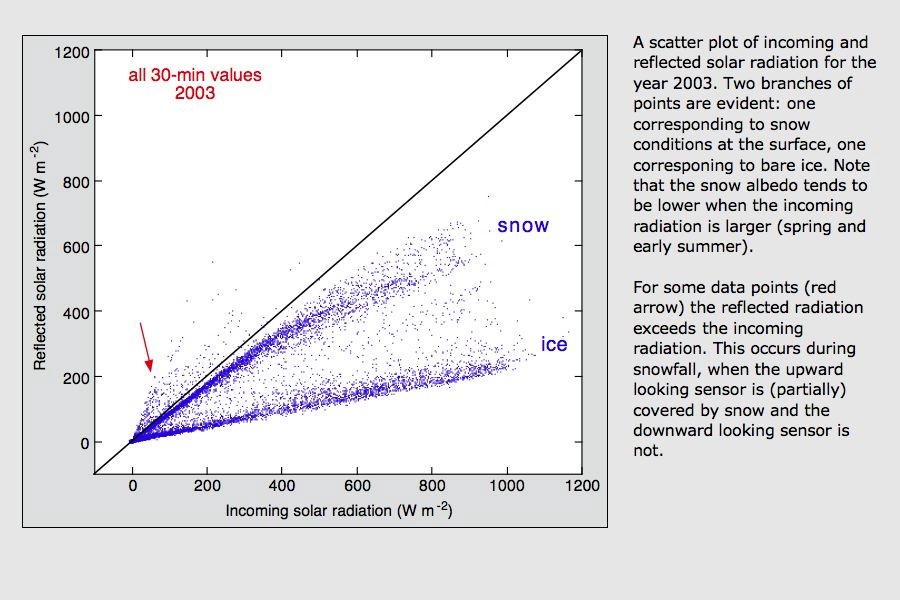
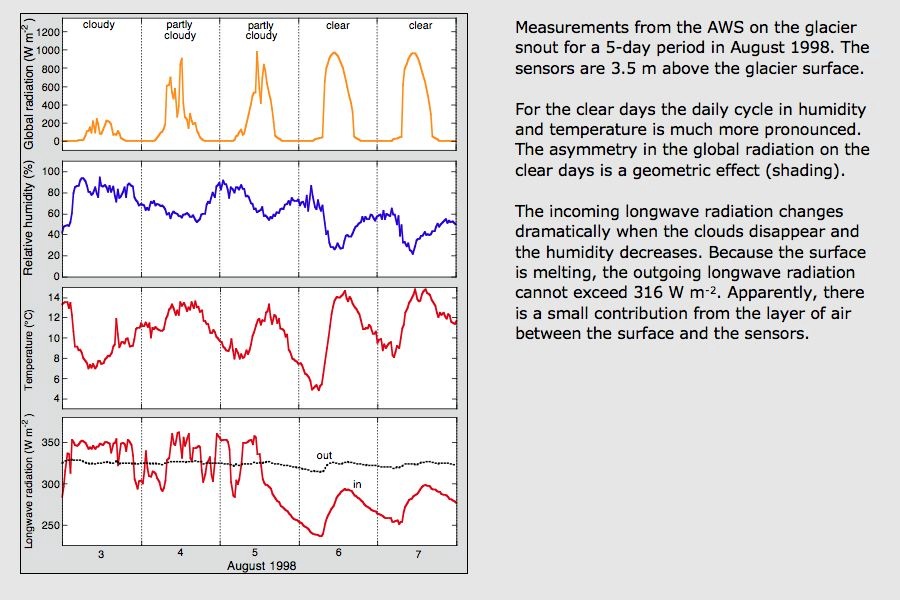
Scatter plot of 30-min values of incoming and outgoing solar radiation (one year). | Close-up of measurements for a few days, illustrating the difference between cloudy and clear days. |
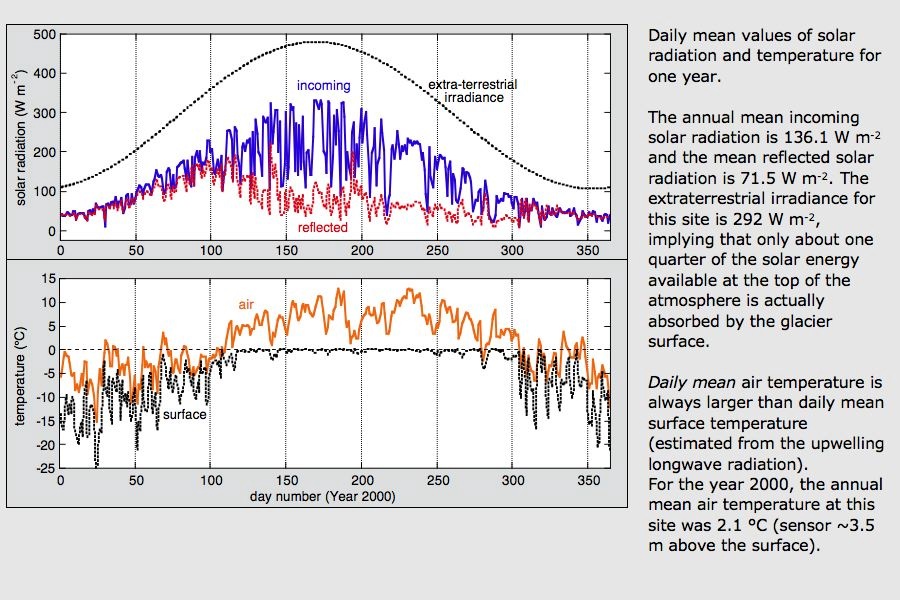
Daily mean values of solar radiation and temperature for the Year 2000. |
|
|
|
|
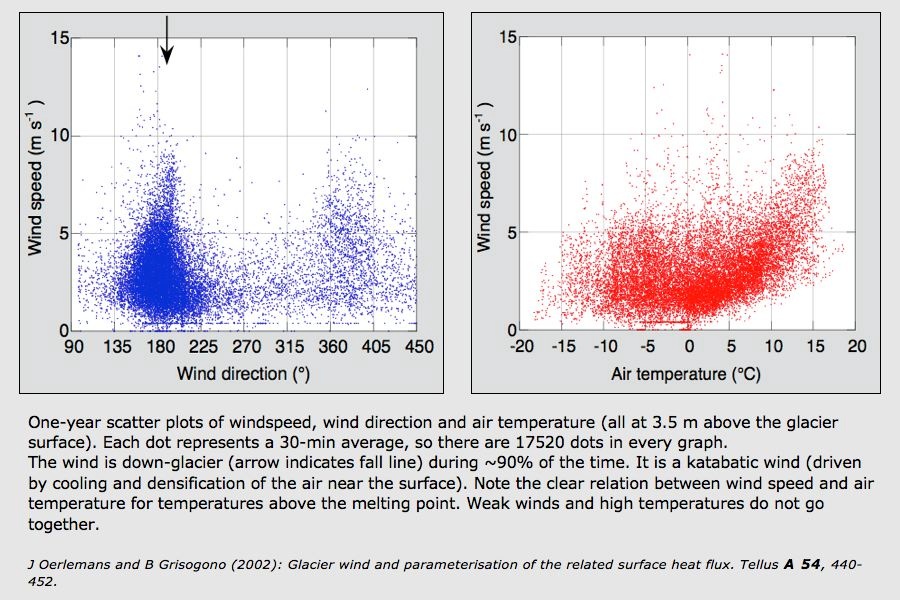
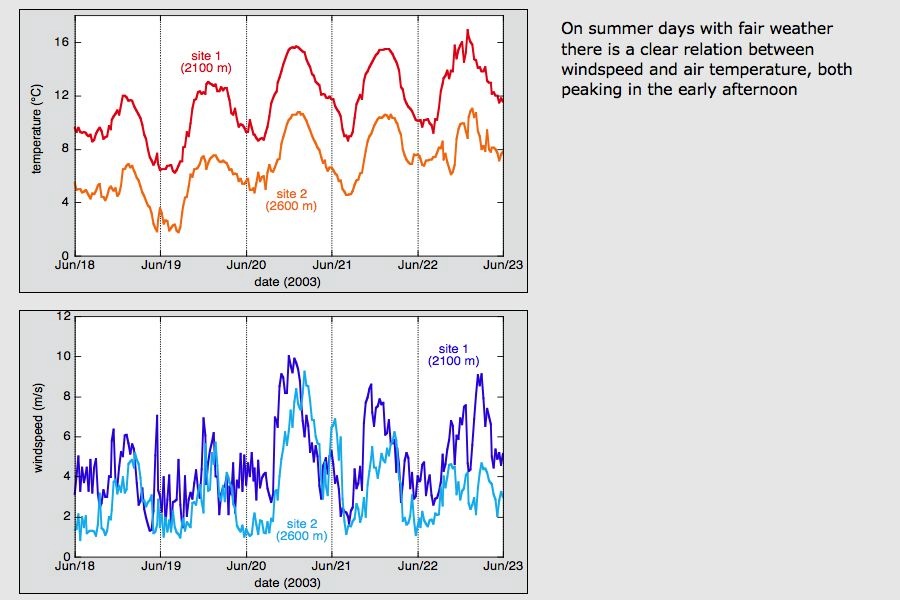
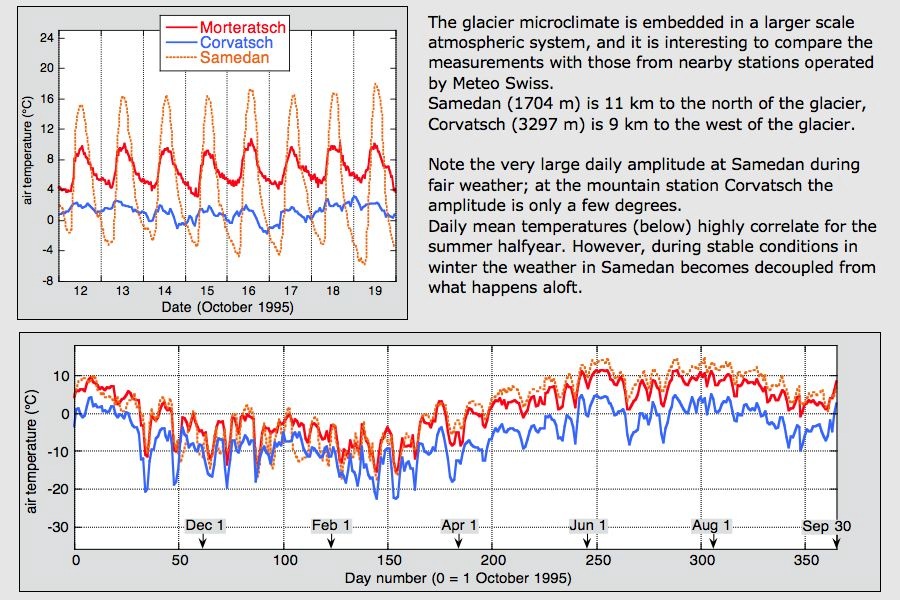
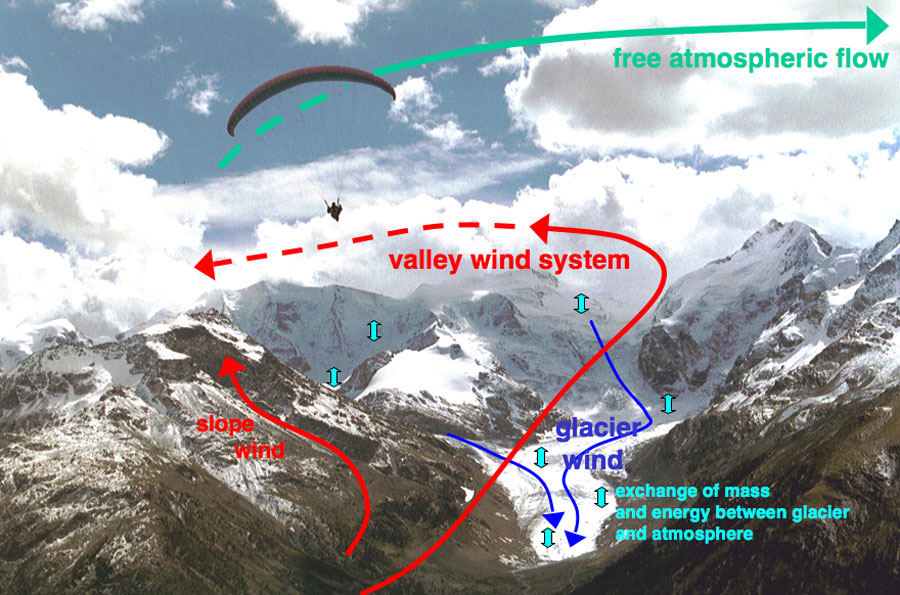
| Glacier wind dominates the wind climatology. The wind blows down-glacier during 90% of the time, in summer and winter. | On clear days there is a pronounced daily cycle in the strength of the glacier wind, peaking in the afternoon. | A comparison of measurements on the glacier with those at the Swiss Meteo stations of Samedan (1704 m) and Corvatsch (3297 m). |
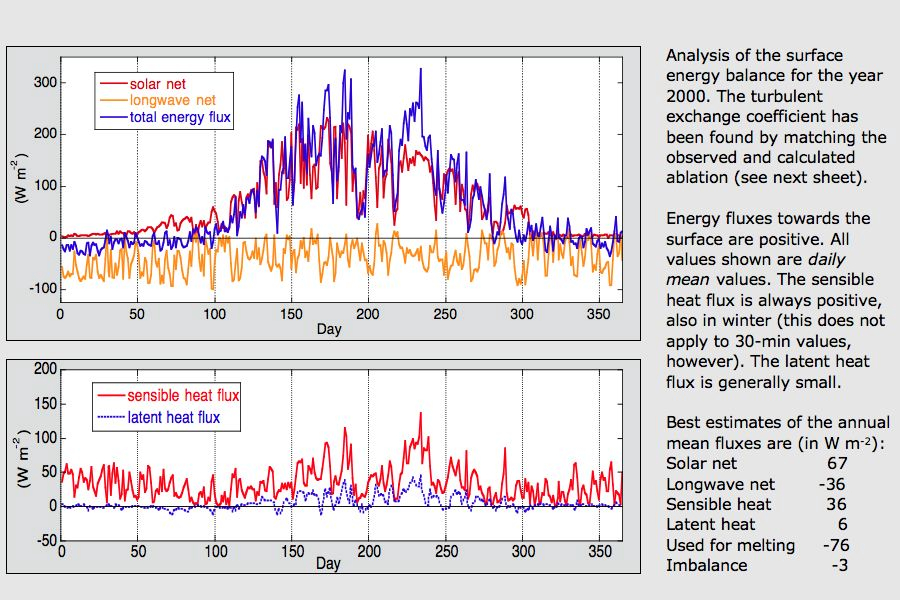
An evaluation of the components of the surface energy budget for the year 2000. |
|
|
||
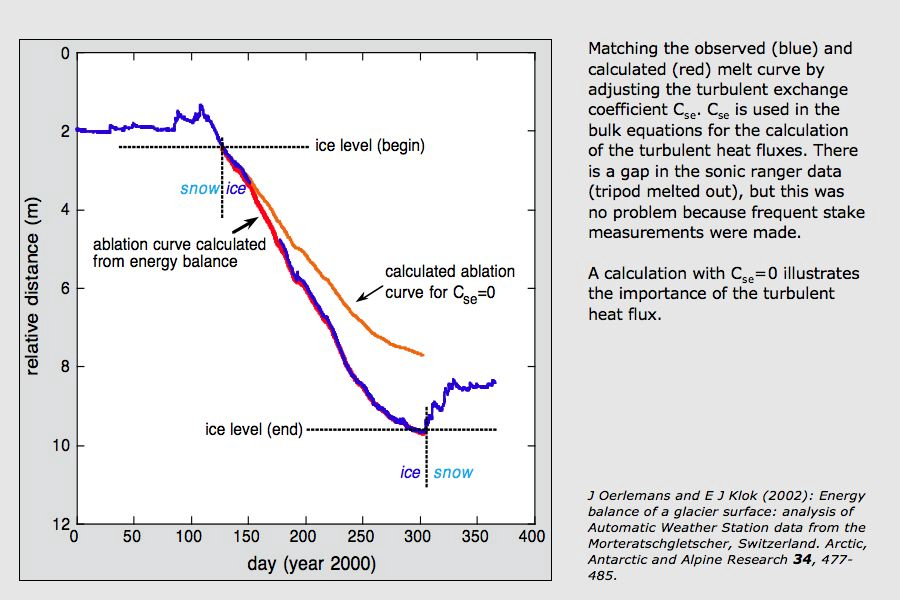
| Matching the observed and calculated ablation curve by adjusting the turbulent exchange coefficient. | In summary, it is a complicated business, and we need some modelling work to tie it all together. |