This column: bitmaps
This column: postscript

[jpg] DOT poster
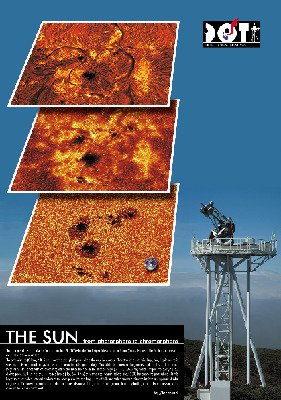
DOT tomography poster designed by Frans Snik. You are welcome to request a paper copy from Marion Wijburg, Sterrekundig Instituut Utrecht, Postbus 80000, 3508 TA Utrecht, The Netherlands.
[ps] DOT poster
Same in postscript
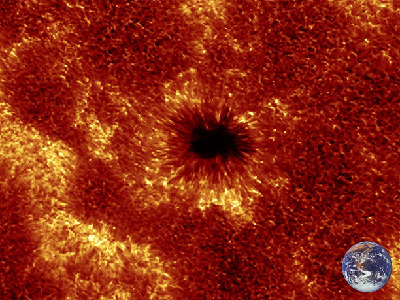
[png] AR10786 in Halpha
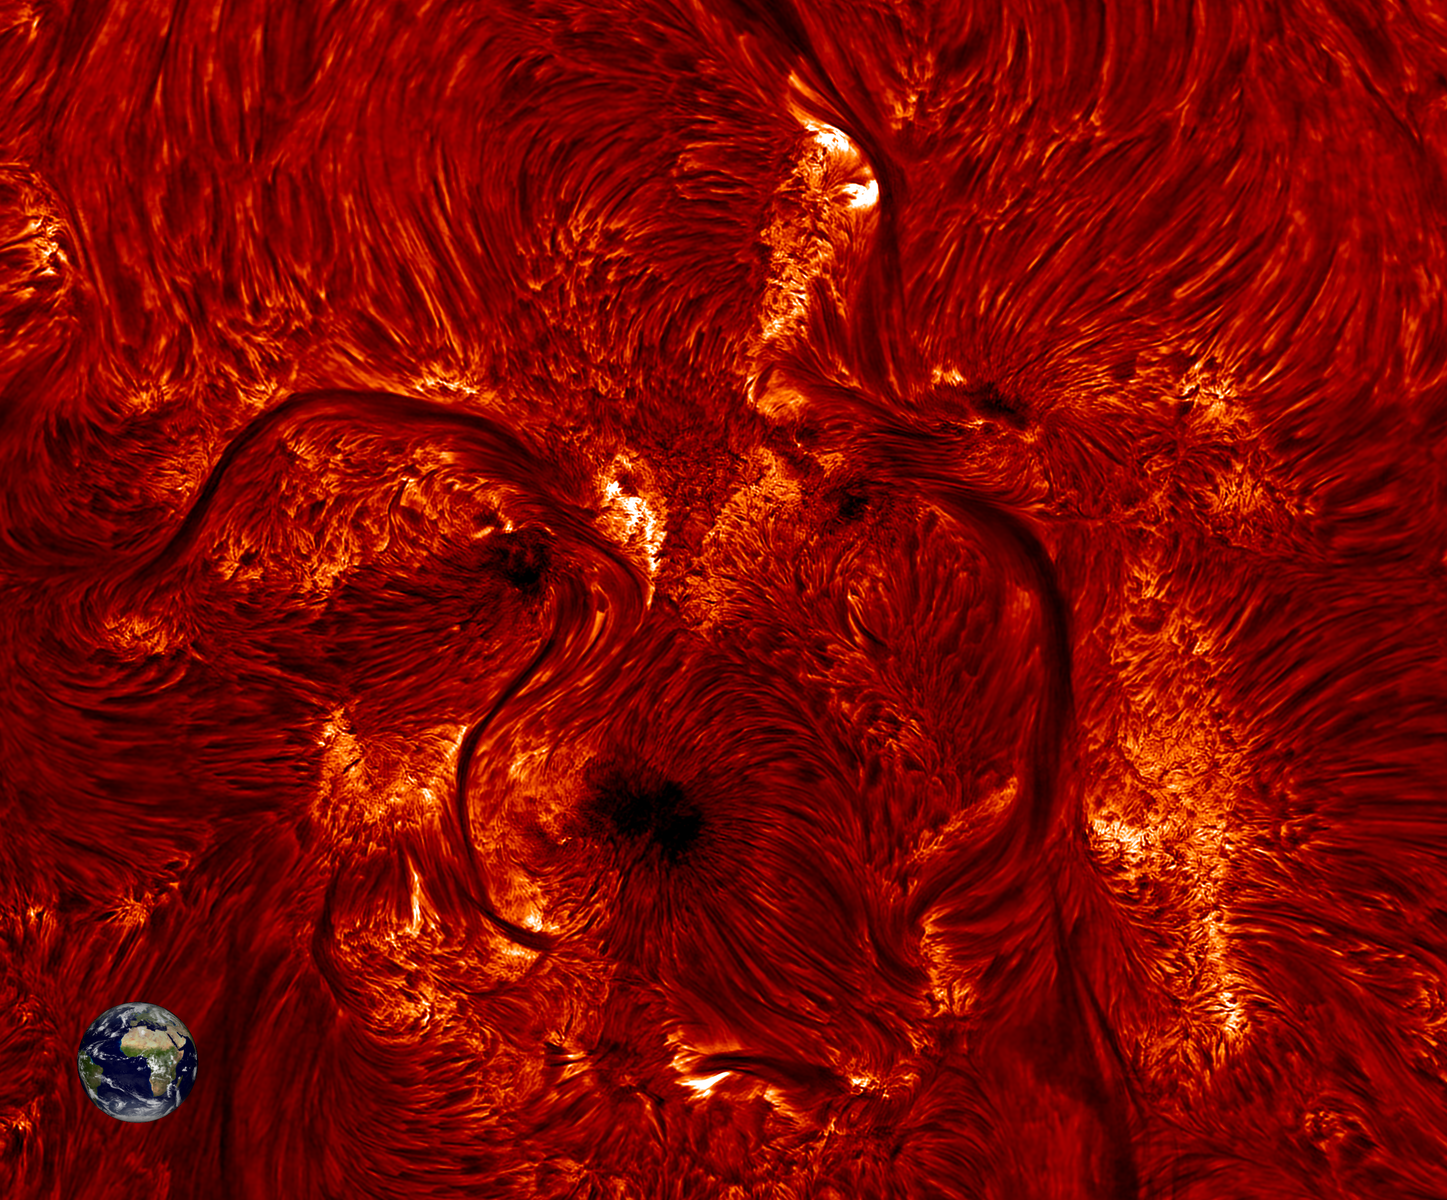
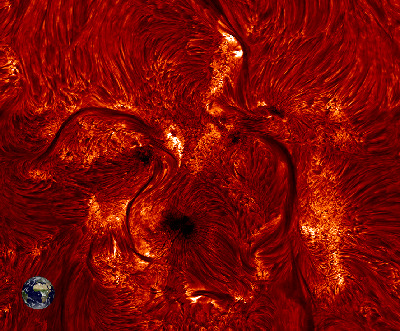
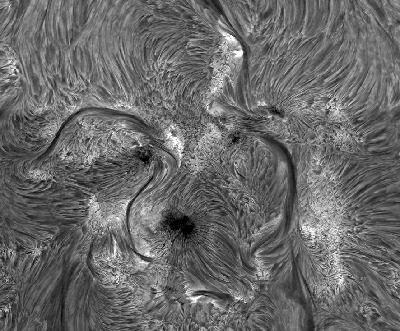
DOT picture of the sun. Solar active region AR10786 in a mosaic of 2 by 2 DOT images taken on July 8, 2005. The field measures 182 x 133 arcsec. The inserted Earth photograph indicates the scale. The sunspot umbrae remain dark in Halpha. Many so-called fibrils emanate away from the sunspots. They outline magnetic connections between different areas, like iron filings around a bar magnet. The many fibrils show how complex solar magnetism is arranged within the solar atmosphere. The whitish areas surrounding the sunspots are plage, where large numbers of magnetic elements cluster together. The long slender dark structures are active region filaments. They end in bipolar regions where both positive and negative magnetic fields emerge through the solar surface. The coloring is artificial.
[ps] AR10786 in Halpha
Same in PostScript
[png] AR10786 in Halpha
Same as above but non-colored
[ps] AR10786 in Halpha
Same in PostScript

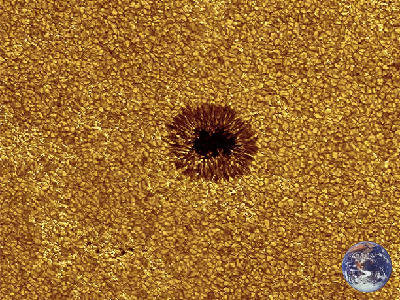
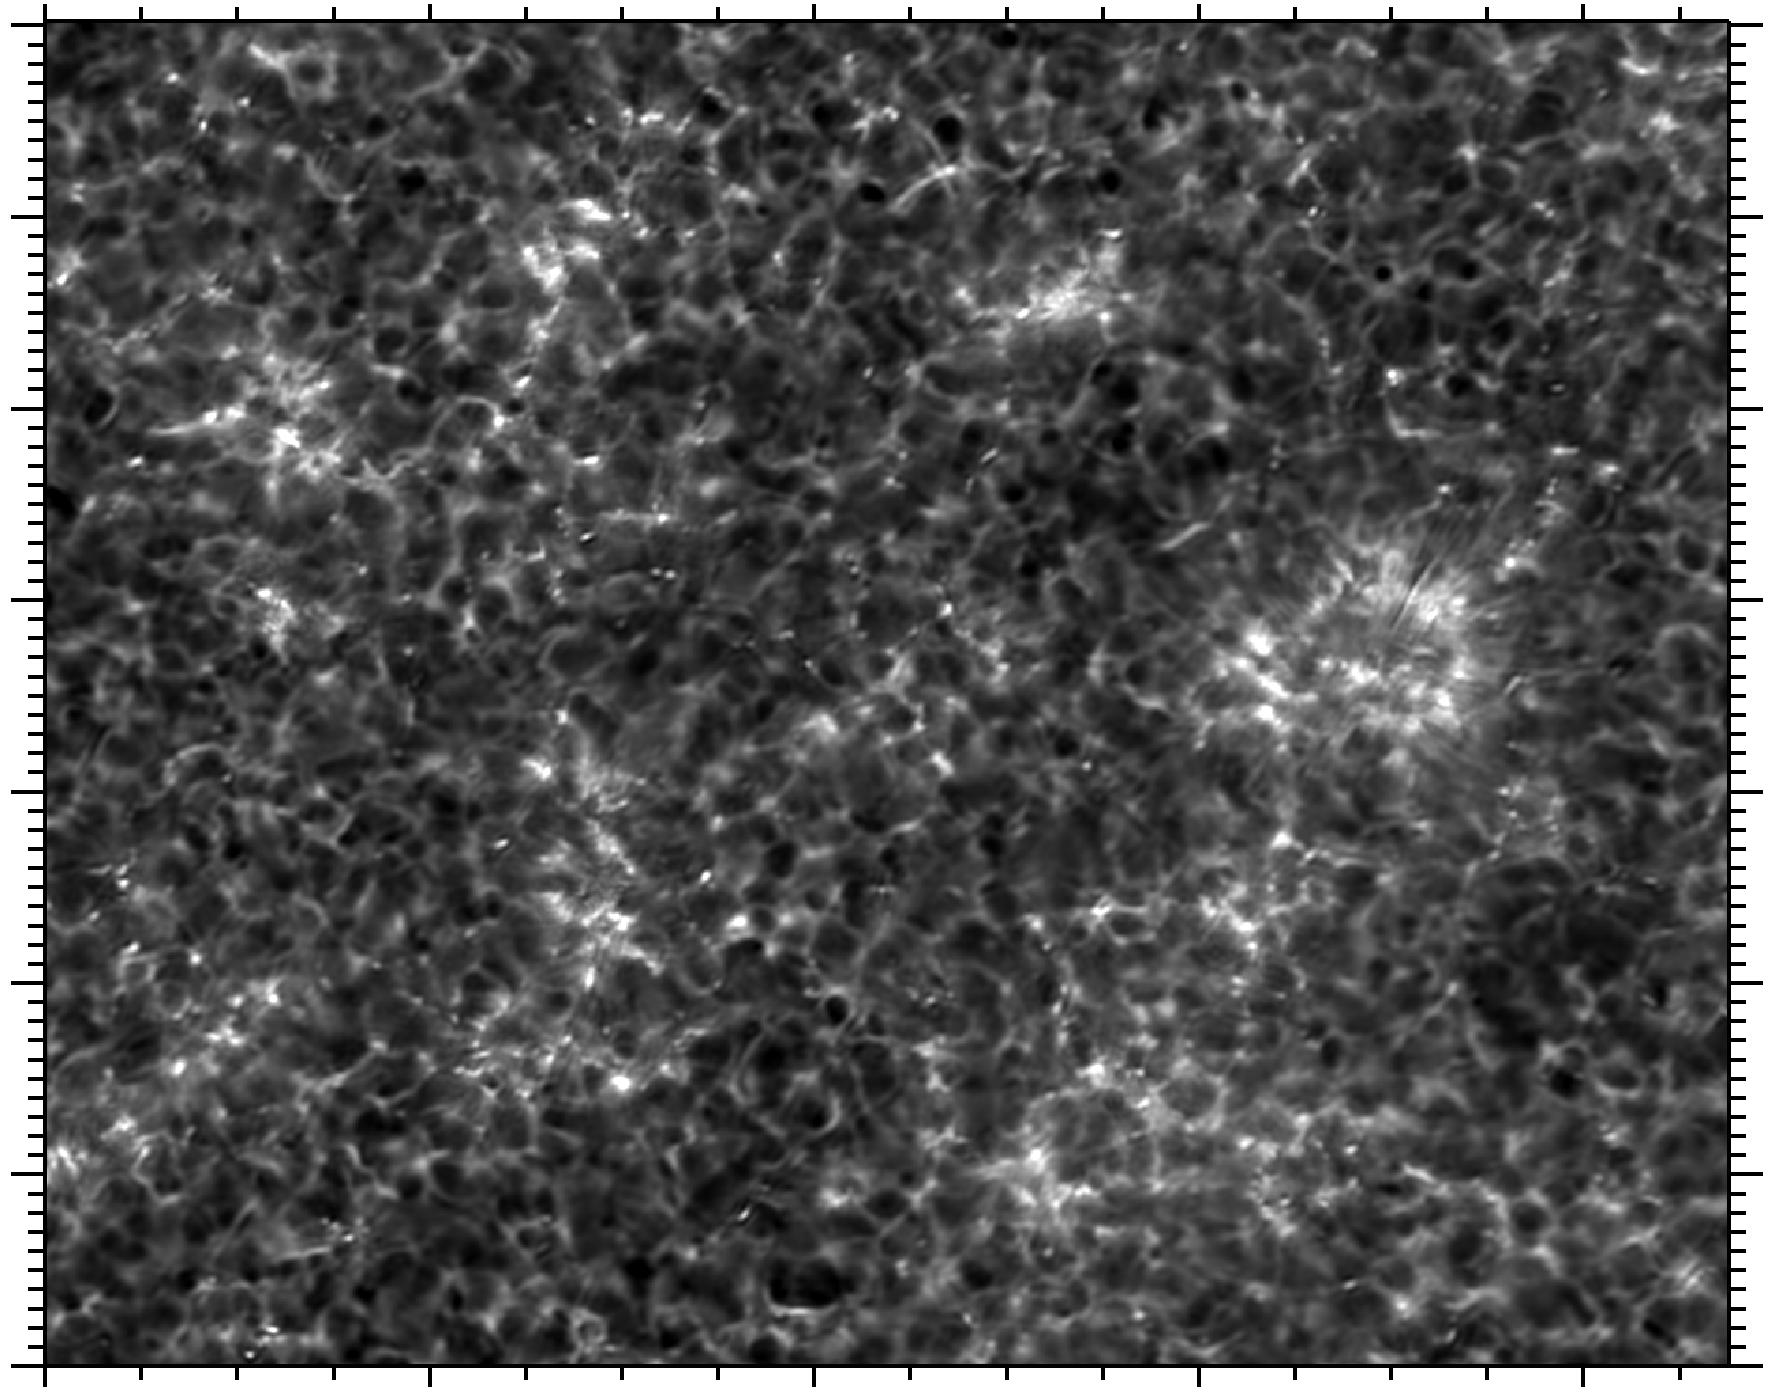
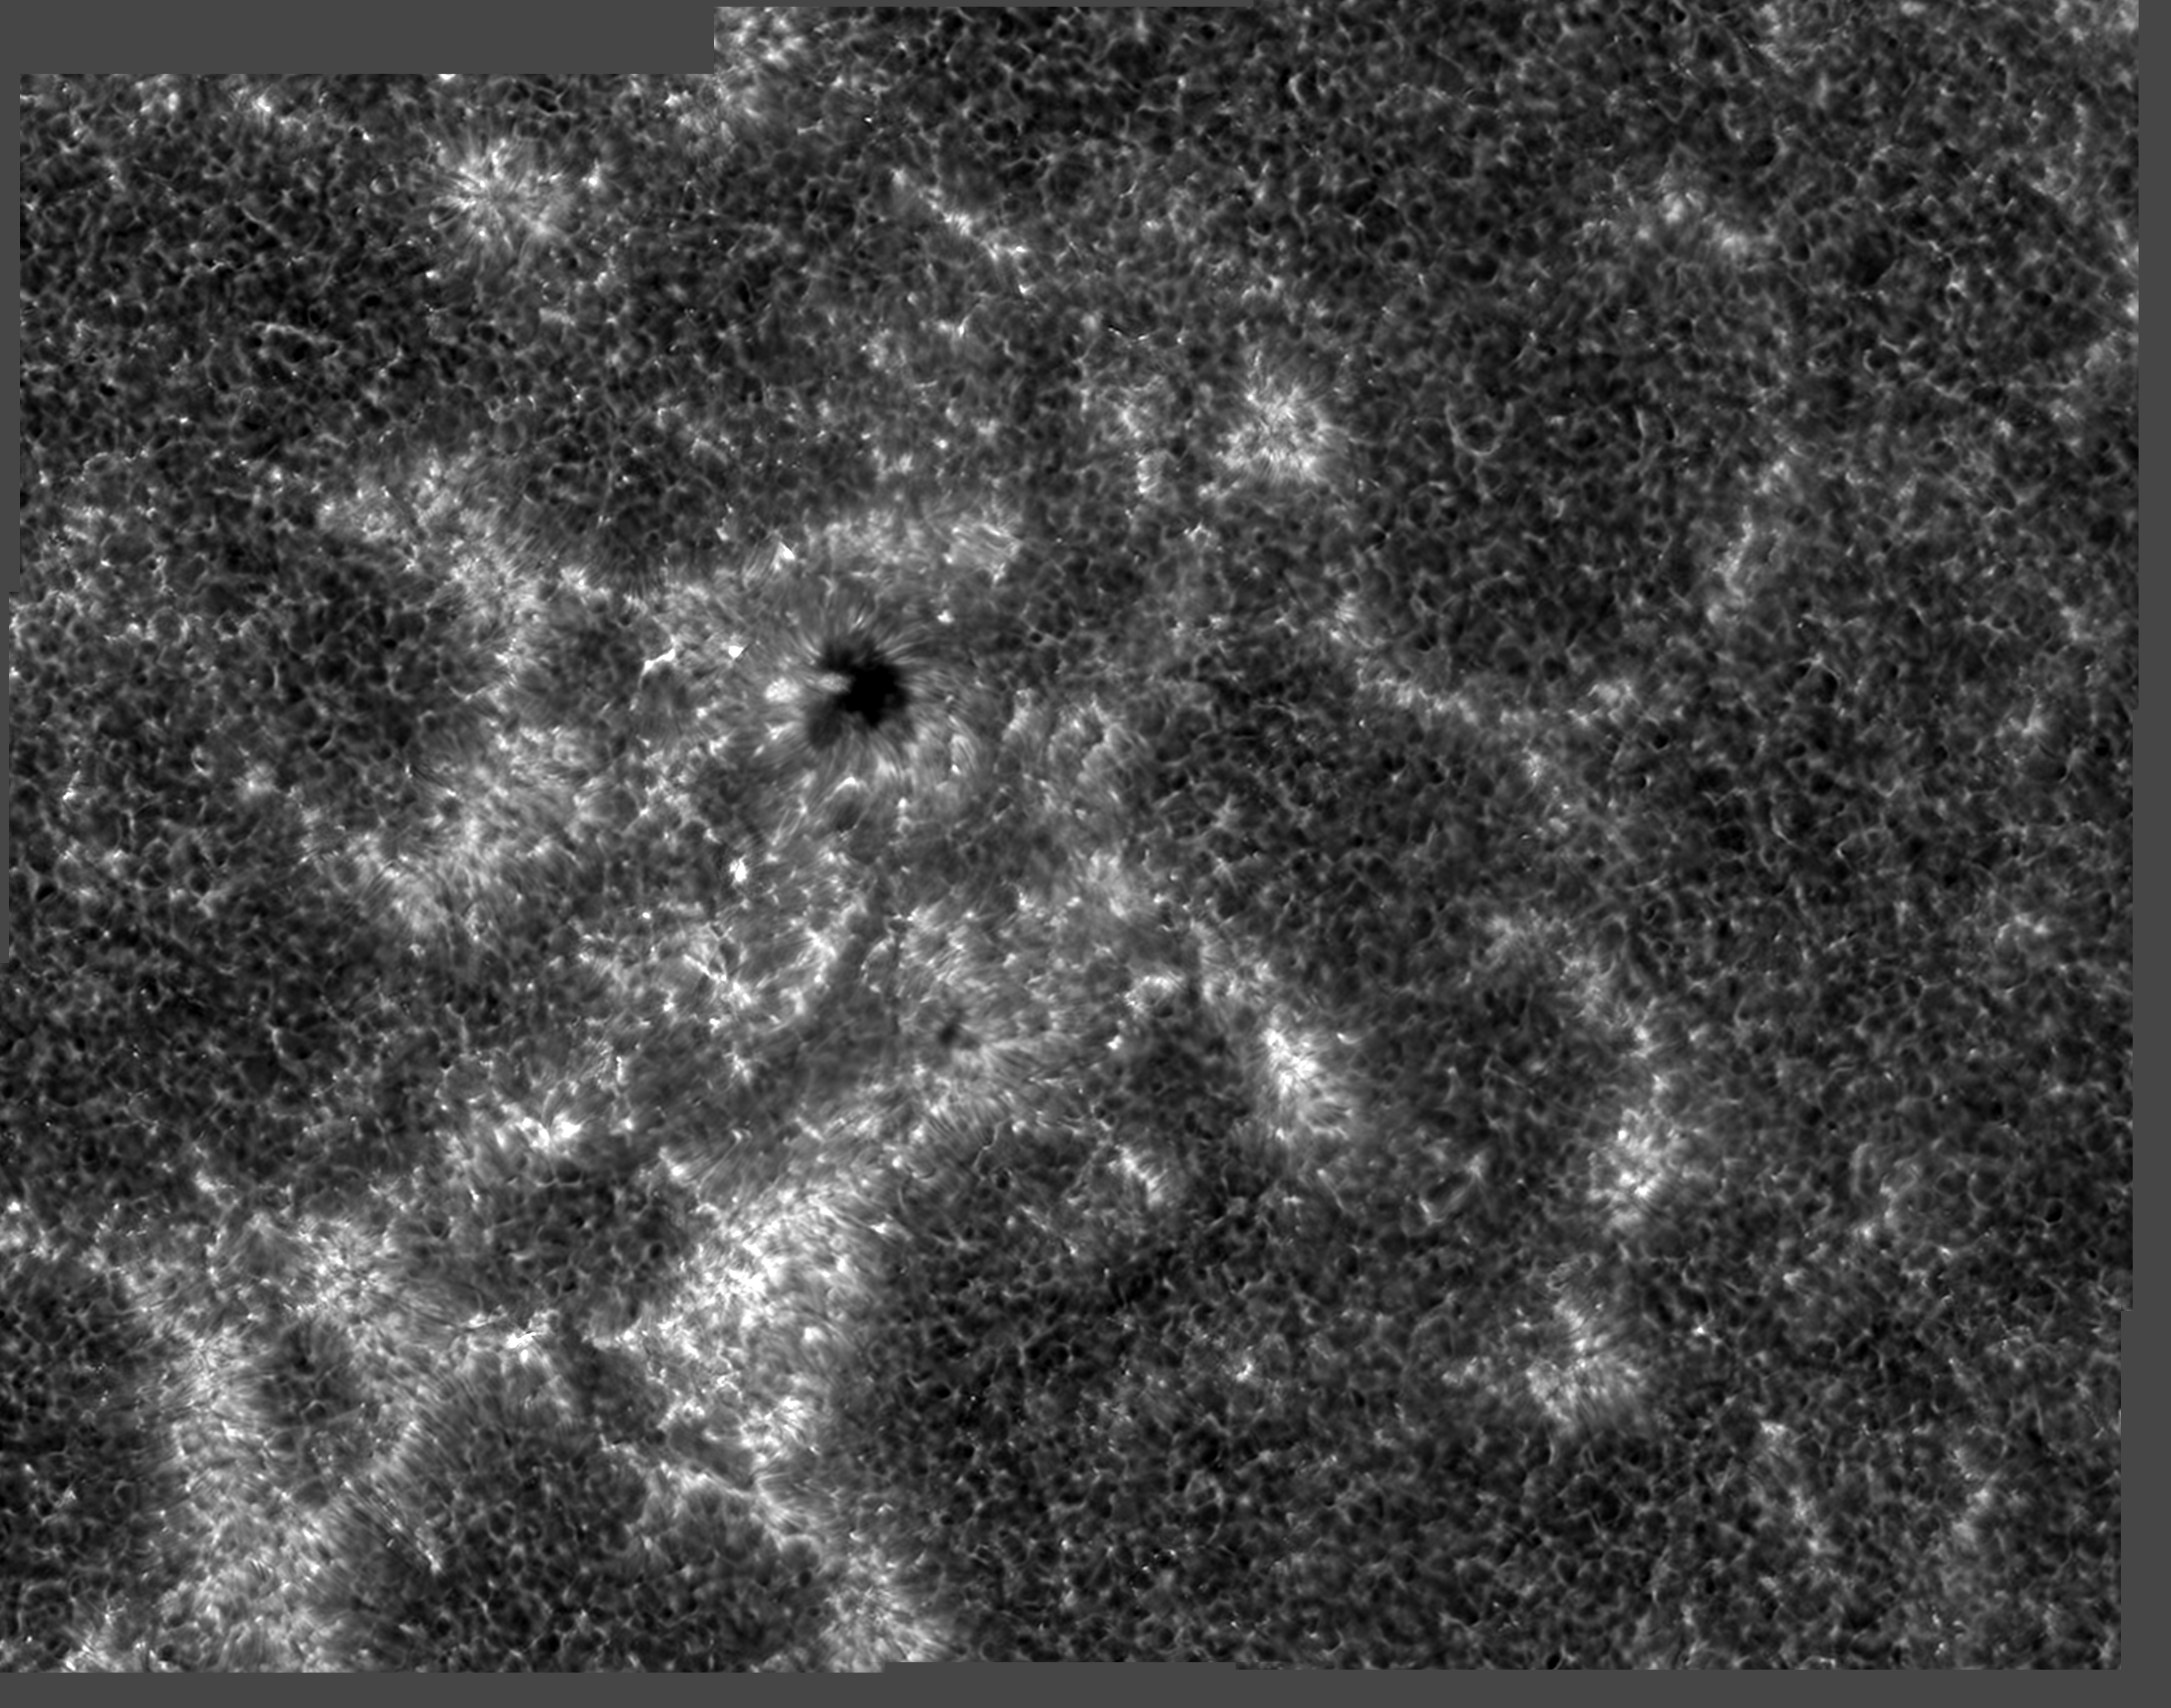
[png] AR10786 in Ca II H
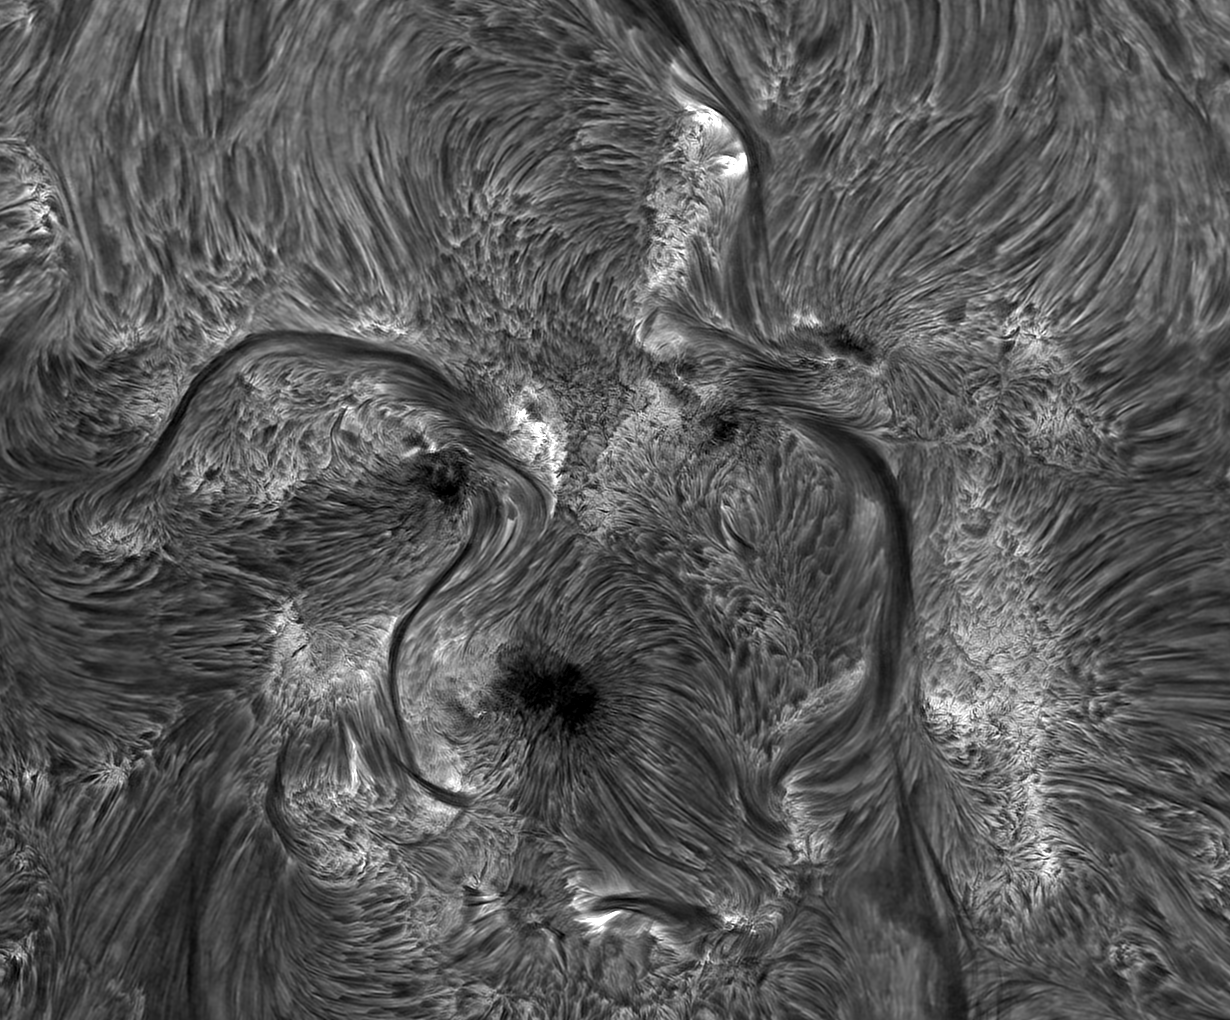
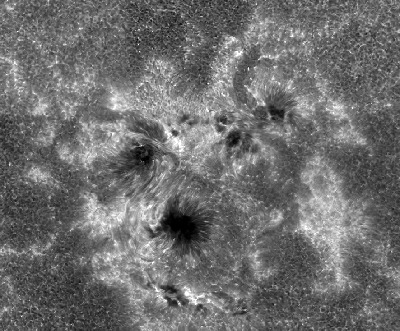
DOT picture of the sun. Same solar area as above but observed in the Ca II H line. This line is due to once-ionised calcium and is one of the two strongest in the visible-light part of the solar spectrum. The other is its companion, the Ca II K line. They are wide adjacent dark features in the violet part of the spectrum (at wavelengths 393.4 nm for K and 398.5 nm for H). the Ca II H line is formed a few hundred kilometer above the solar surface as seen in white light, sampling layers well below the fibrils seen in the Halpha image above. At this height the magnetic plages are very bright. The dark areas contain "reversed granulation" with a partial contrast reversal of the granulation seen in the corresponding G band image below. Some isolated small bright features in the dark areas are due to shocks in the solar atmosphere, made by low-frequency sound waves that travel upward and steepen into shocks where the gas density decreases at larger height.
[ps] AR10786 in Ca II H
Same in PostScript

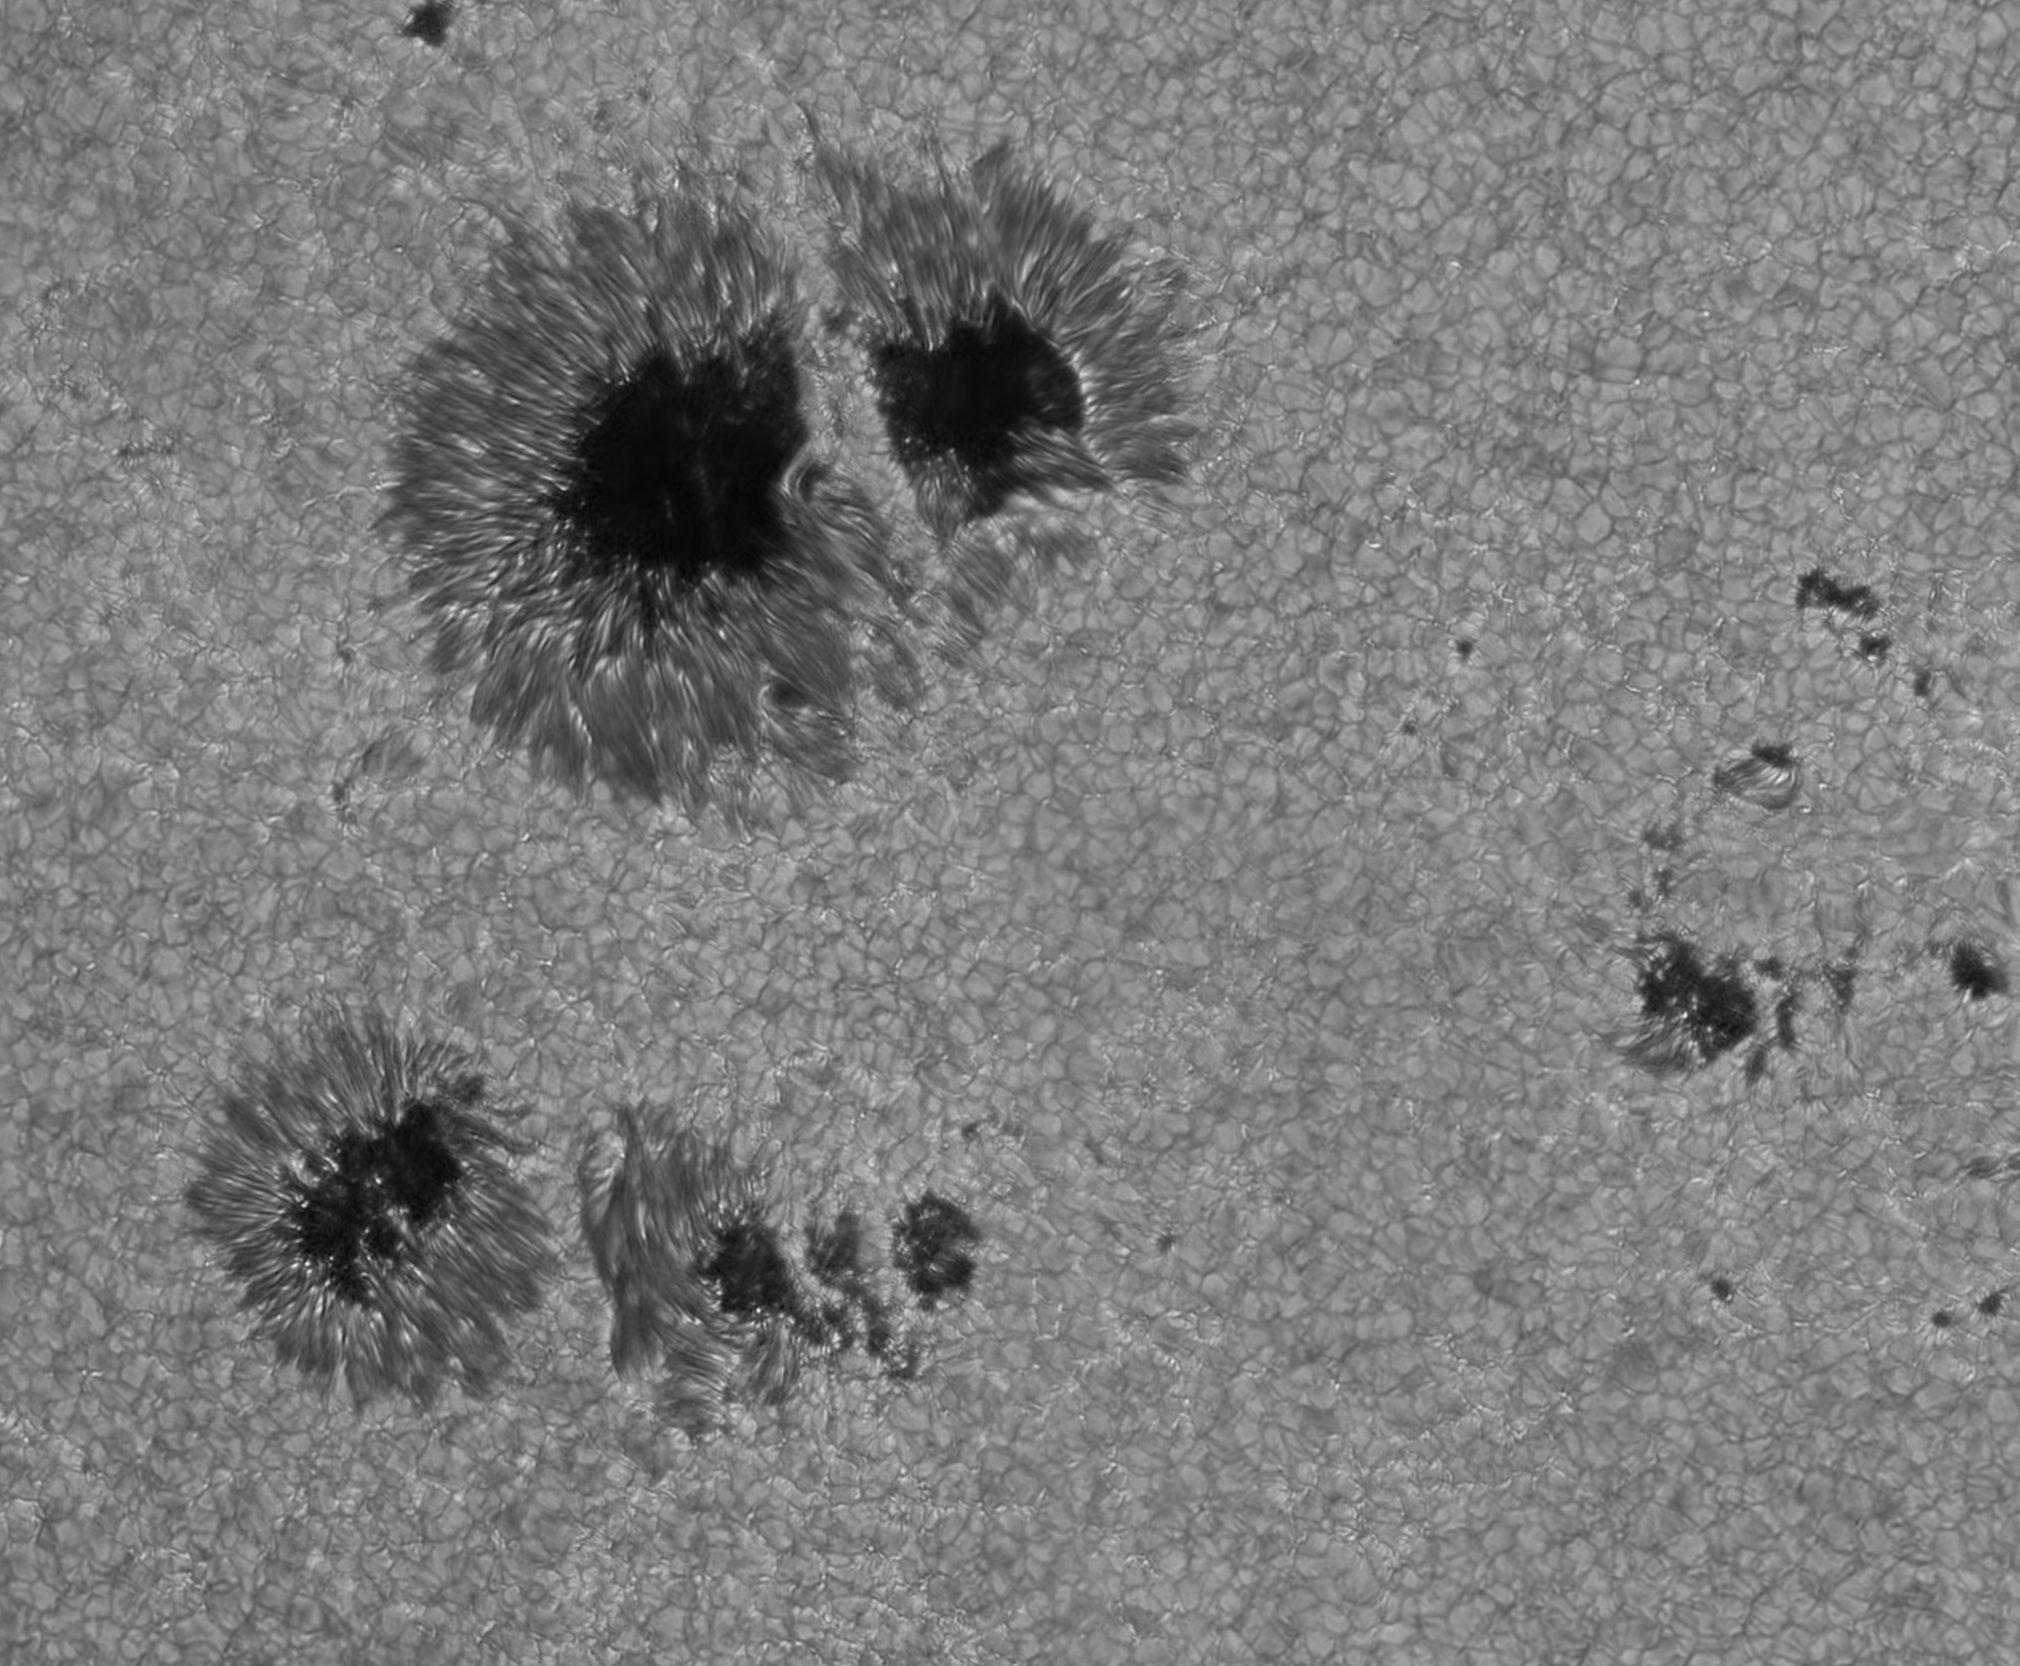
[png] AR10786 in G band
DOT picture of the sun. Same solar area as above but observed in the G band. This wide dark feature in the blue part of the solar spectrum consists of a multitude of spectral lines due to the molecule CH. Images taken in this feature, such as this one, show the solar photosphere, the "surface" where the visible sunlight escapes. It is not a real surface (you cannot stand on it, the sun is made of gas inside-out), but simply the level to which our view penetrates because the light escapes there. The solar atmosphere actually has very low gas density at the height where it becomes transparent, much lower than the air density around us on the Earth's surface whereas the latter is still transparent. The solar gas obtains its large intransparency from its abundance of hydrogen atoms, some of which catch an extra electron and use that to produce or absorb visible-light photons. Those photons that are produced in this manner and then escape represent the bright continuous spectrum of the sun on which the spectral lines are superimposed as dark "absorption" features. These are not really due to simple absorption but to lower temperature at the larger heights in the solar atmosphere where the photons within the lines escape. Outside the active region the G band shows granulation, the pattern of greyish blobs surrounded by dark integranular lanes. This granulation is the solar surface manifestation of the convection by which the sun transports energy through the outer 1/3 of its body. The convective motions transfer energy upward just as boiling water in a tea kettle. The G band also shows, with special emphasis, magnetic elements appearing as tiny bright points. They cluster within the intergranular lanes, being swept into these by the convective motions. They consist of slender, near-vertical magnetic "fluxtubes" with magnetic field strengts of about 1200-1500 Gauss (much stronger than the Earth's magnetic field of only about 0.5 Gauss). It takes a sharp telescope as the DOT to properly image these fluxtubes as small bright points in the intergranular lanes. They brighten especially in the G band because the CH molecules dissociate within the fluxtubes, making these more transparent viewing pipes into the hotter solar sub-surface gas.
[ps] AR10786 in G band
Same in PostScript

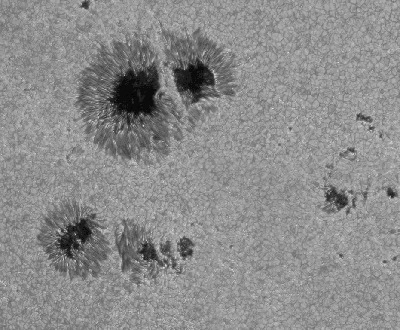
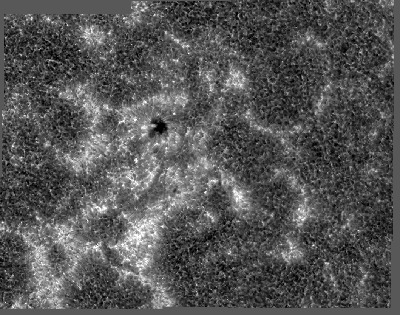
[png] AR10675 Halpha
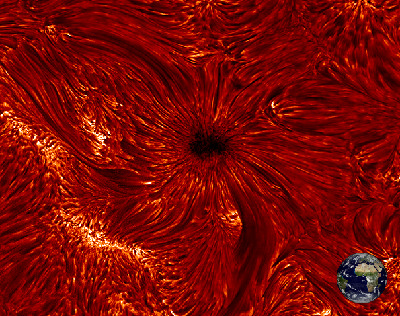
DOT picture of the sun. Solar active region AR10675 on September 29, 2004. The Earth indicates the scale. The sunspot in the center of the image is single, rather small, and regularly shaped. In its dark umbrae it shows bright umbral dots located in the deep photosphere. Outside the umbra, Halpha does not sample such deep layers but instead samples the high chromosphere. It is filled with fibrils which outline magnetic connections from the spot to distant locations with bright plage. The coloring is artificial. See the morphs under "DOT specials".
[ps] AR10675 Halpha
Same in PostScript

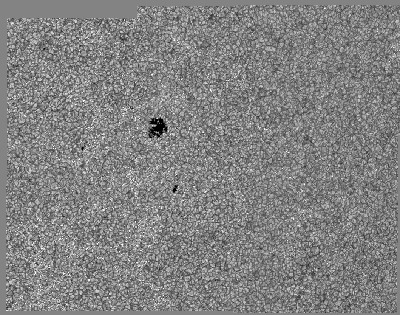
[jpg] AR10675 Ca II H
Same scene as above but in the Ca II H line. More explanation is given with the morphs under "DOT specials".
[ps] AR10675 CaII H
Same in PostScript

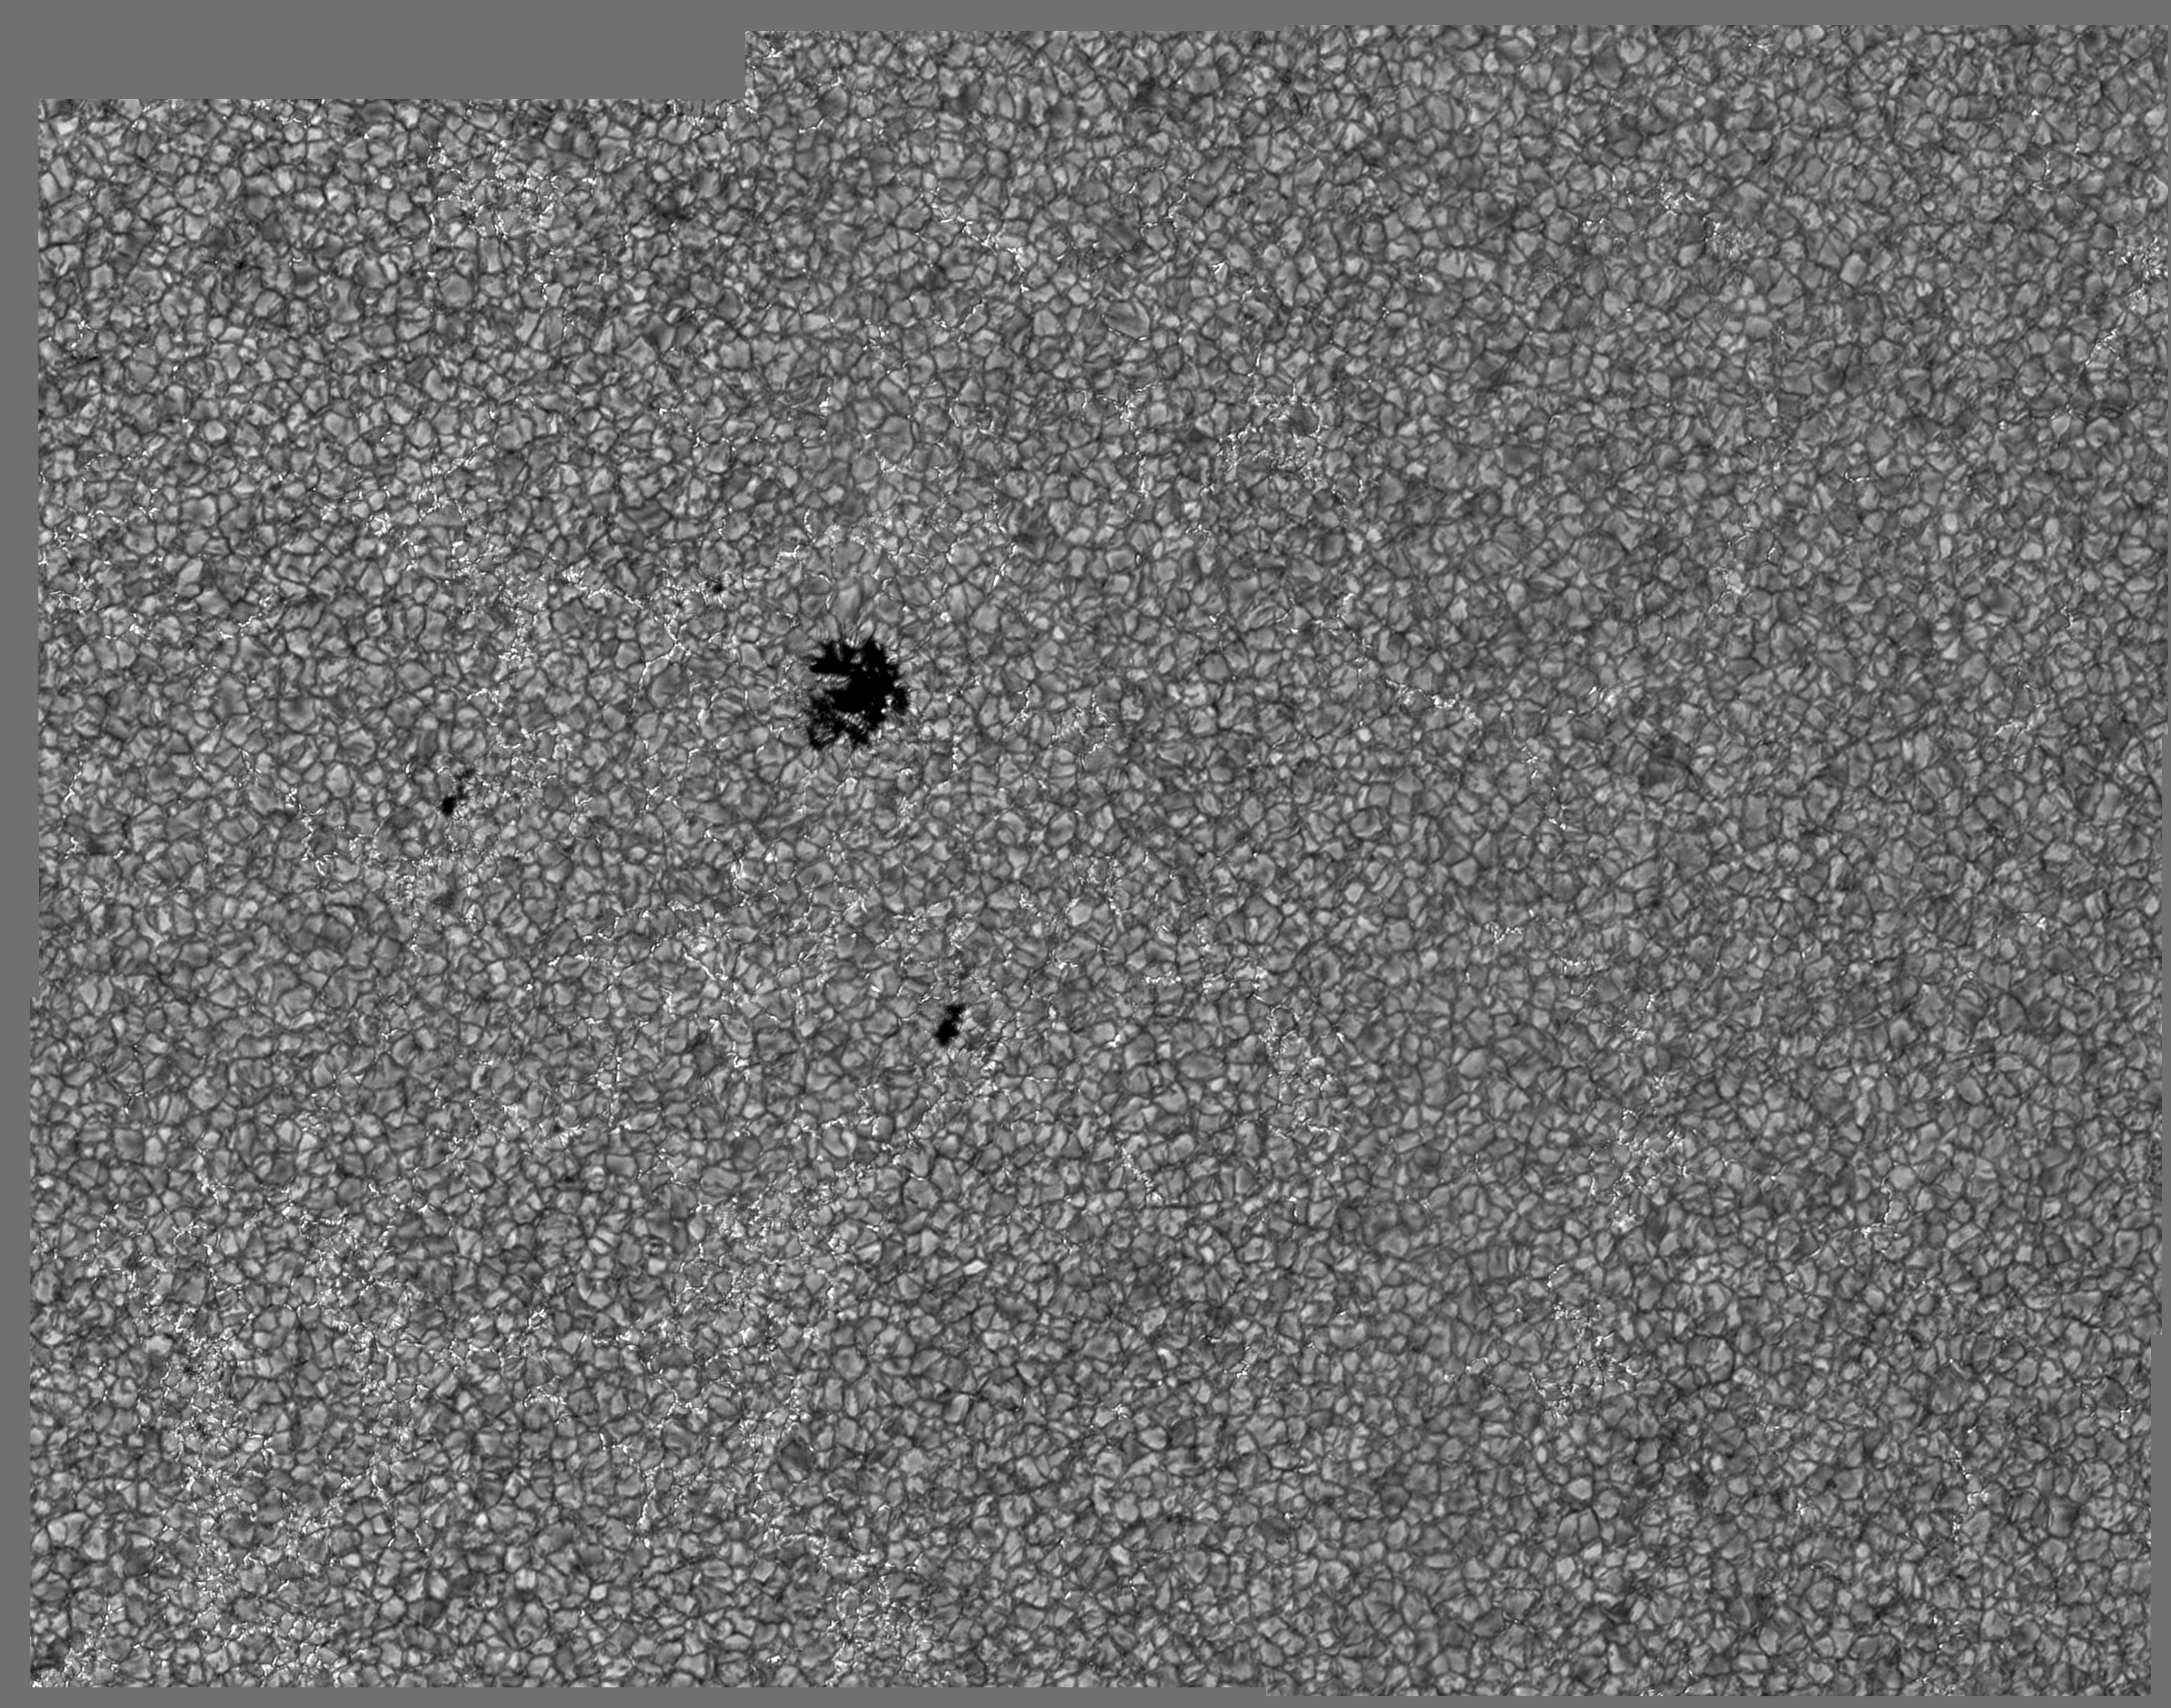
[jpg] AR10675 G band
Same scene as above but in the G band. More explanation is given with the morphs under "DOT specials".
[ps] AR10675 G band
Same in PostScript

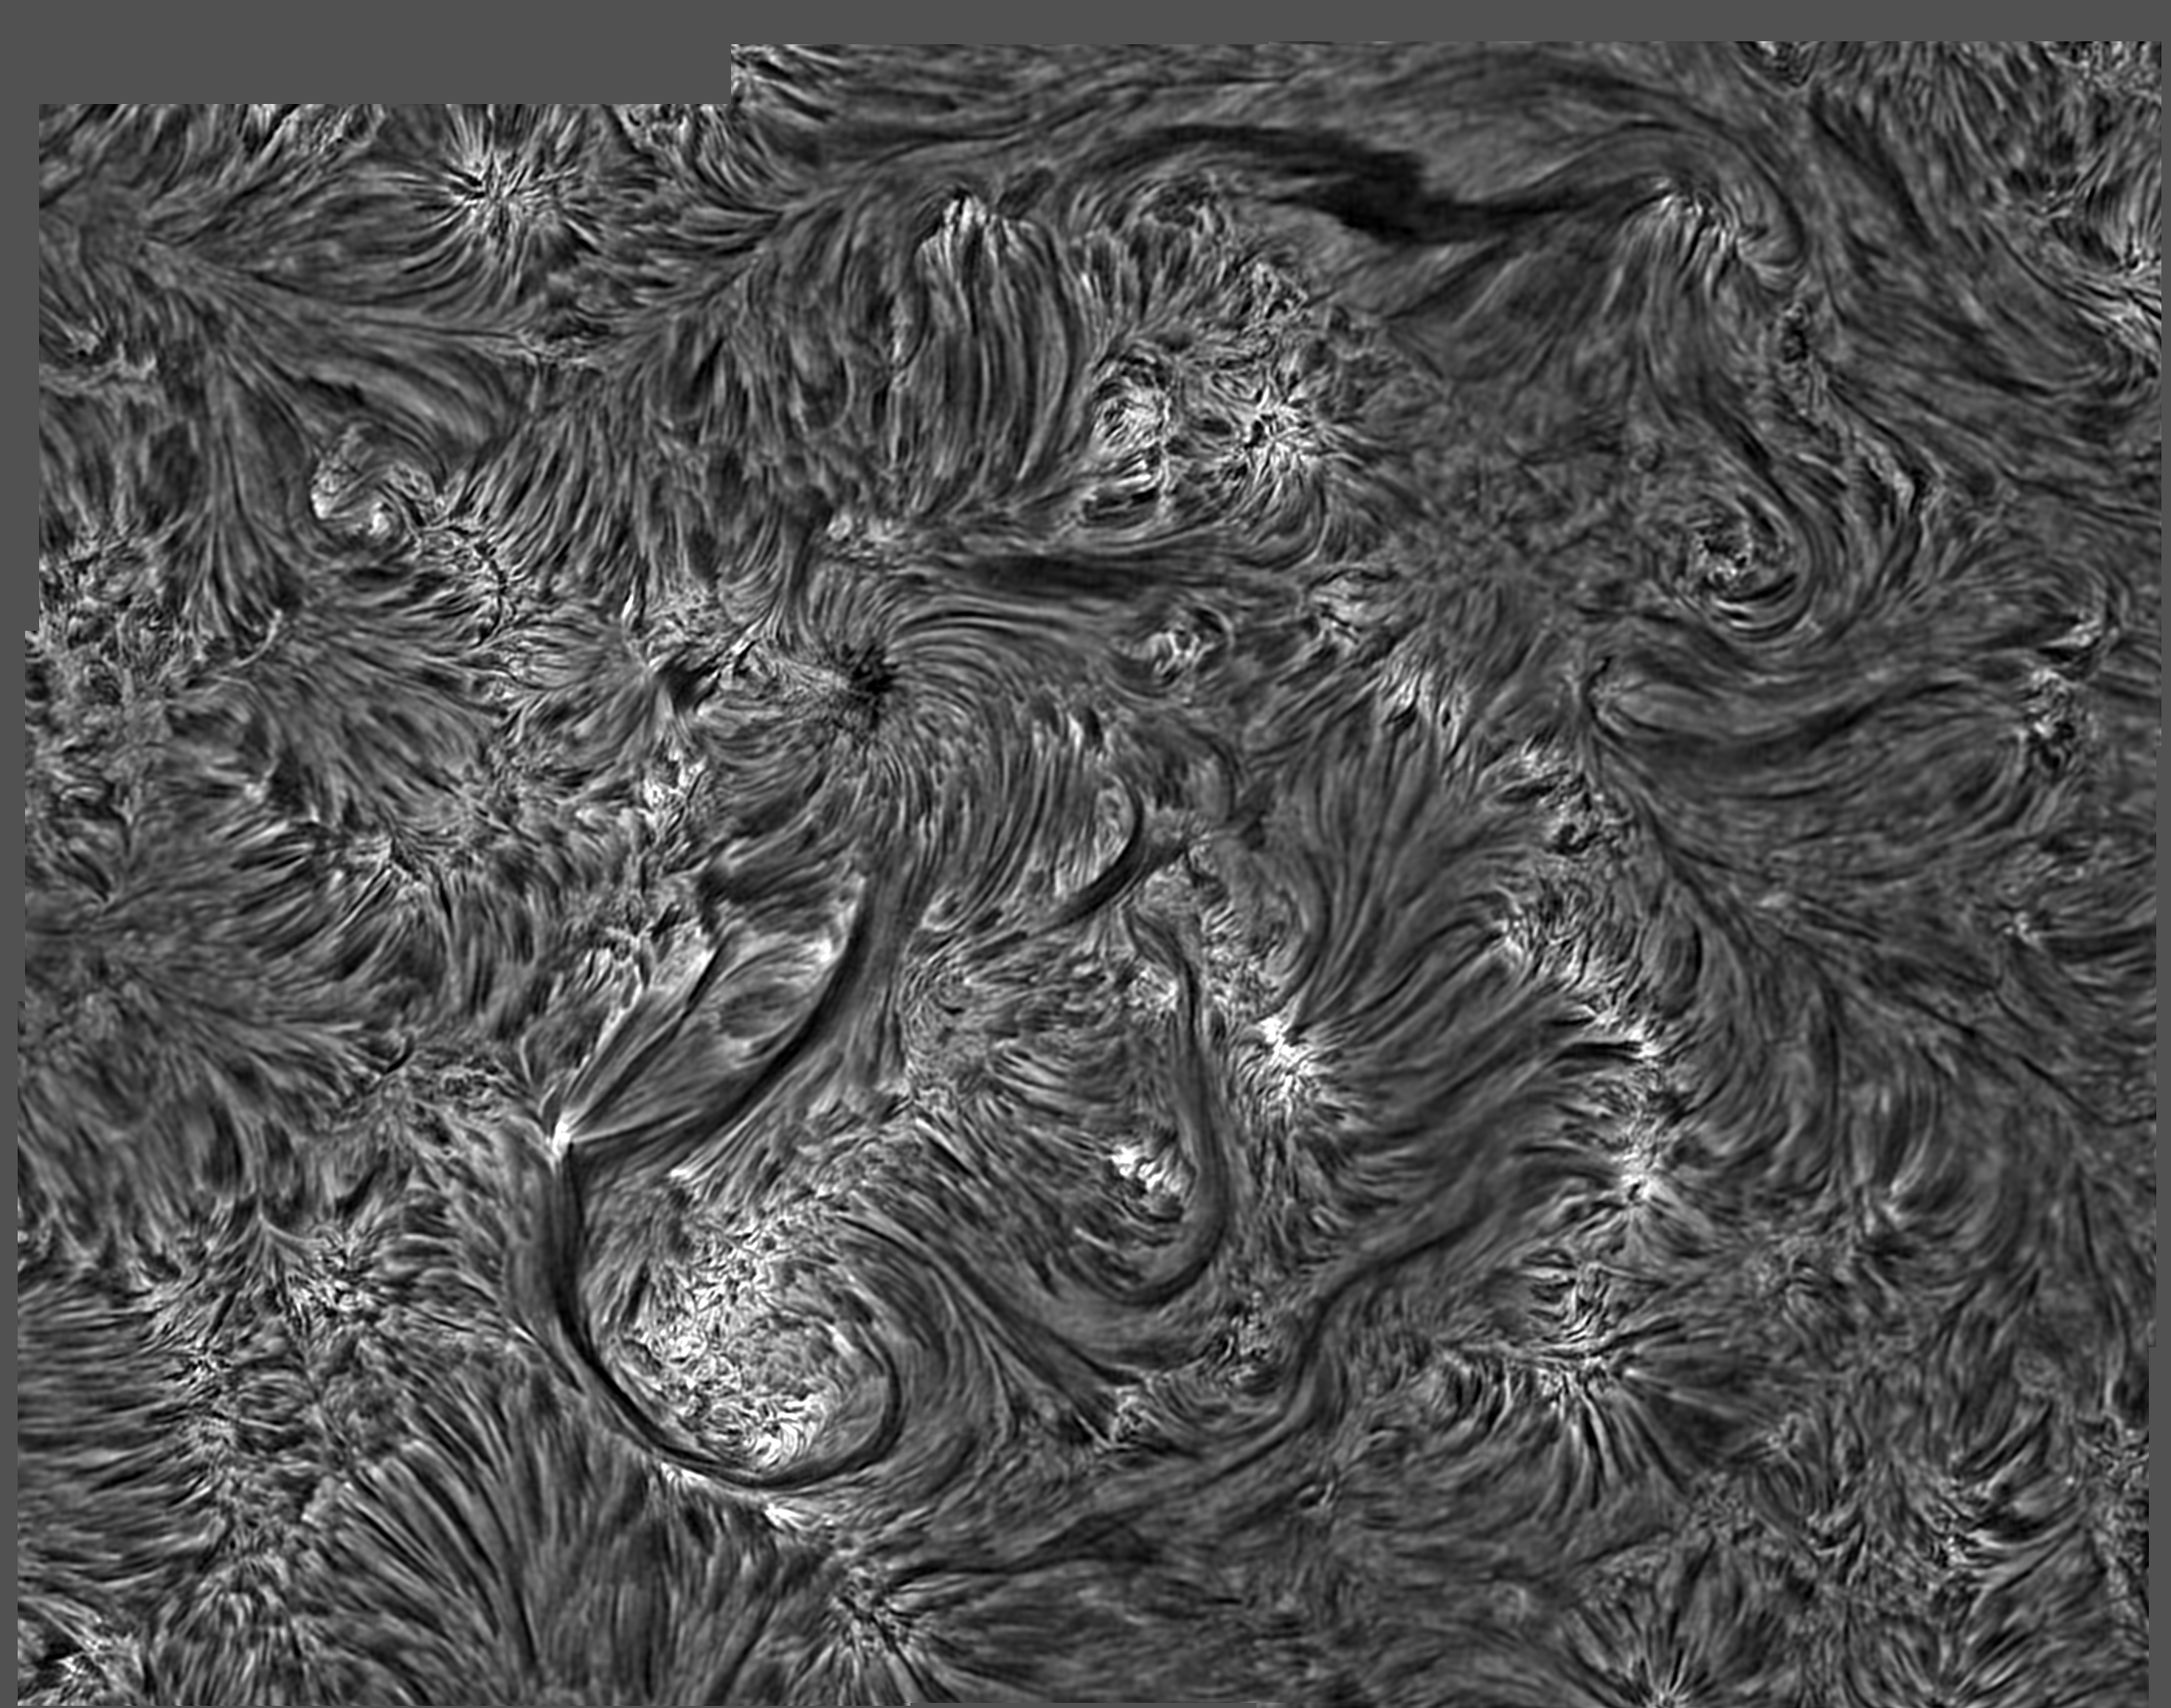
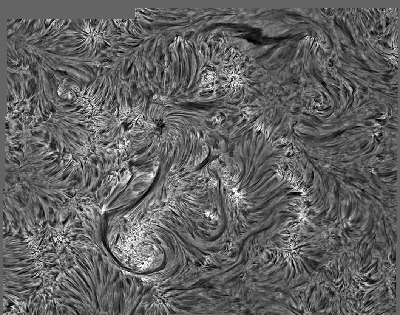
[jpg] Filament in Halpha
DOT picture of the sun. Image mosaic covering the full length of a filament, taken in Halpha on October 6, 2004. Movies of the gap at its center are provided under DOT movies.
[ps] Filament in Halpha
Same in PostScript
[jpg] Full-sun North-South strip
DOT picture of the sun. An image mosaic covering a meridional strip over the whole sun from its North limb to its South limb, passing disk center. Display it at high resolution and scroll from left (North) to right (South). Taken in the G band on September 13, 2004.
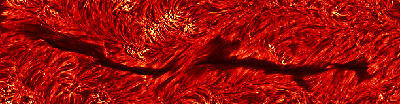
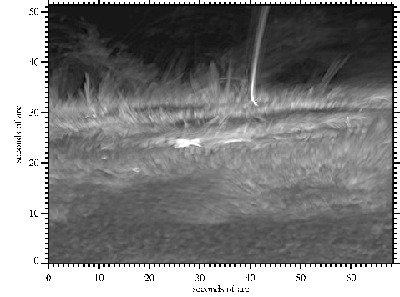
[png] AR10486 surge in Ca II H
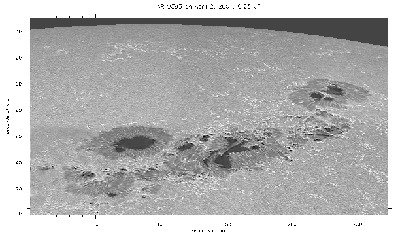
DOT picture of the sun. On November 4, 2003, just before active region AR10486 rotated out of sight over the limb to the backside of the sun and then sent off the largest flare on record, it displayed this bright stalk-like feature calles a surge during a few hours. It may have resulted from magnetic reconnection. The sunspots appear as flat dark pancakes amidst bushes of chromospheric fibrils. The foreground shows reversed granulation in the mid photosphere.
[ps] AR10486 surge
Same in PostScript
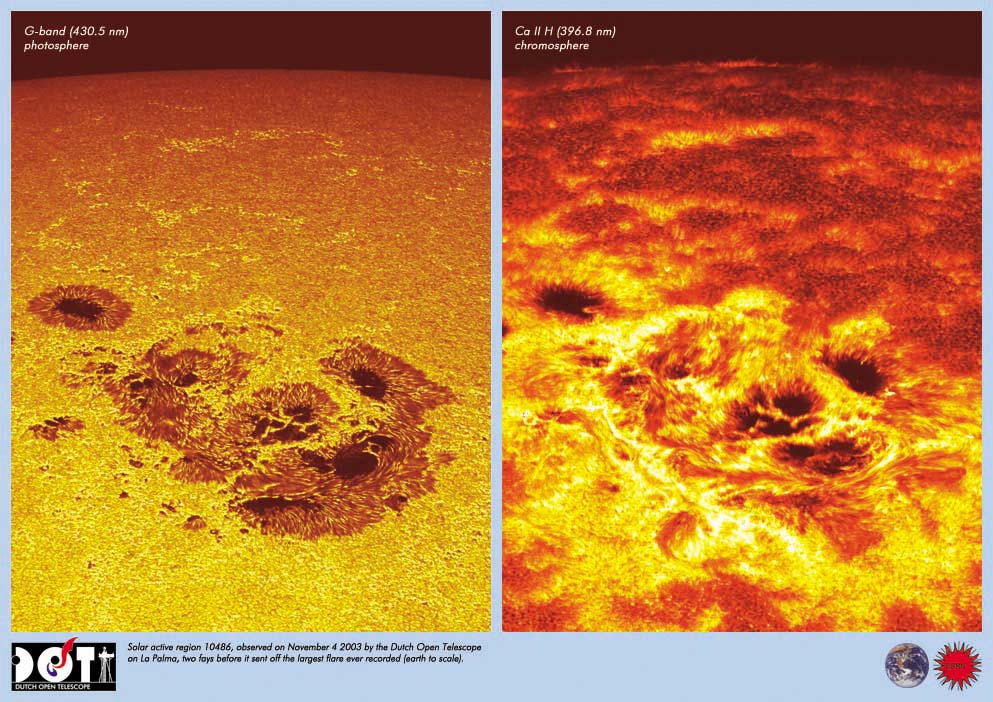
[jpg] AR10486 on DOT poster
DOT poster with pictures of the sun. AR10486 photographed on November 2, 2003 (not November 4 as the poster says). Left: G-band image sampling the photosphere. Right: image in the Ca II H line of once-ionized calcium, sampling the chromosphere. The solar magnetic fields become more important in the chromosphere, and become brighter due to magnetic heating processes. This is also evident in the areas around the sunpots and the "hedges" of brightness towards the solar limb.

[ps] AR10486 on DOT poster
Same in PostScript

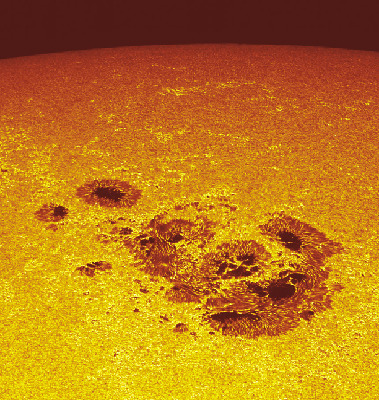
[jpg] G-band image of the DOT poster
[ps] G-band image of the DOT poster

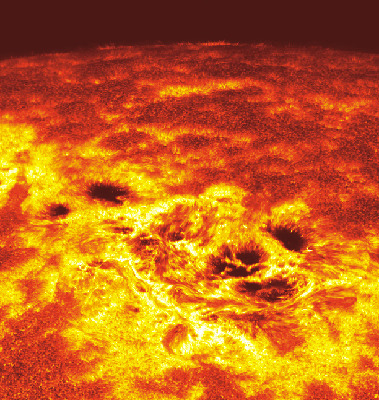
[jpg] Ca II H image of the DOT poster
[ps] Ca II image of the DOT poster
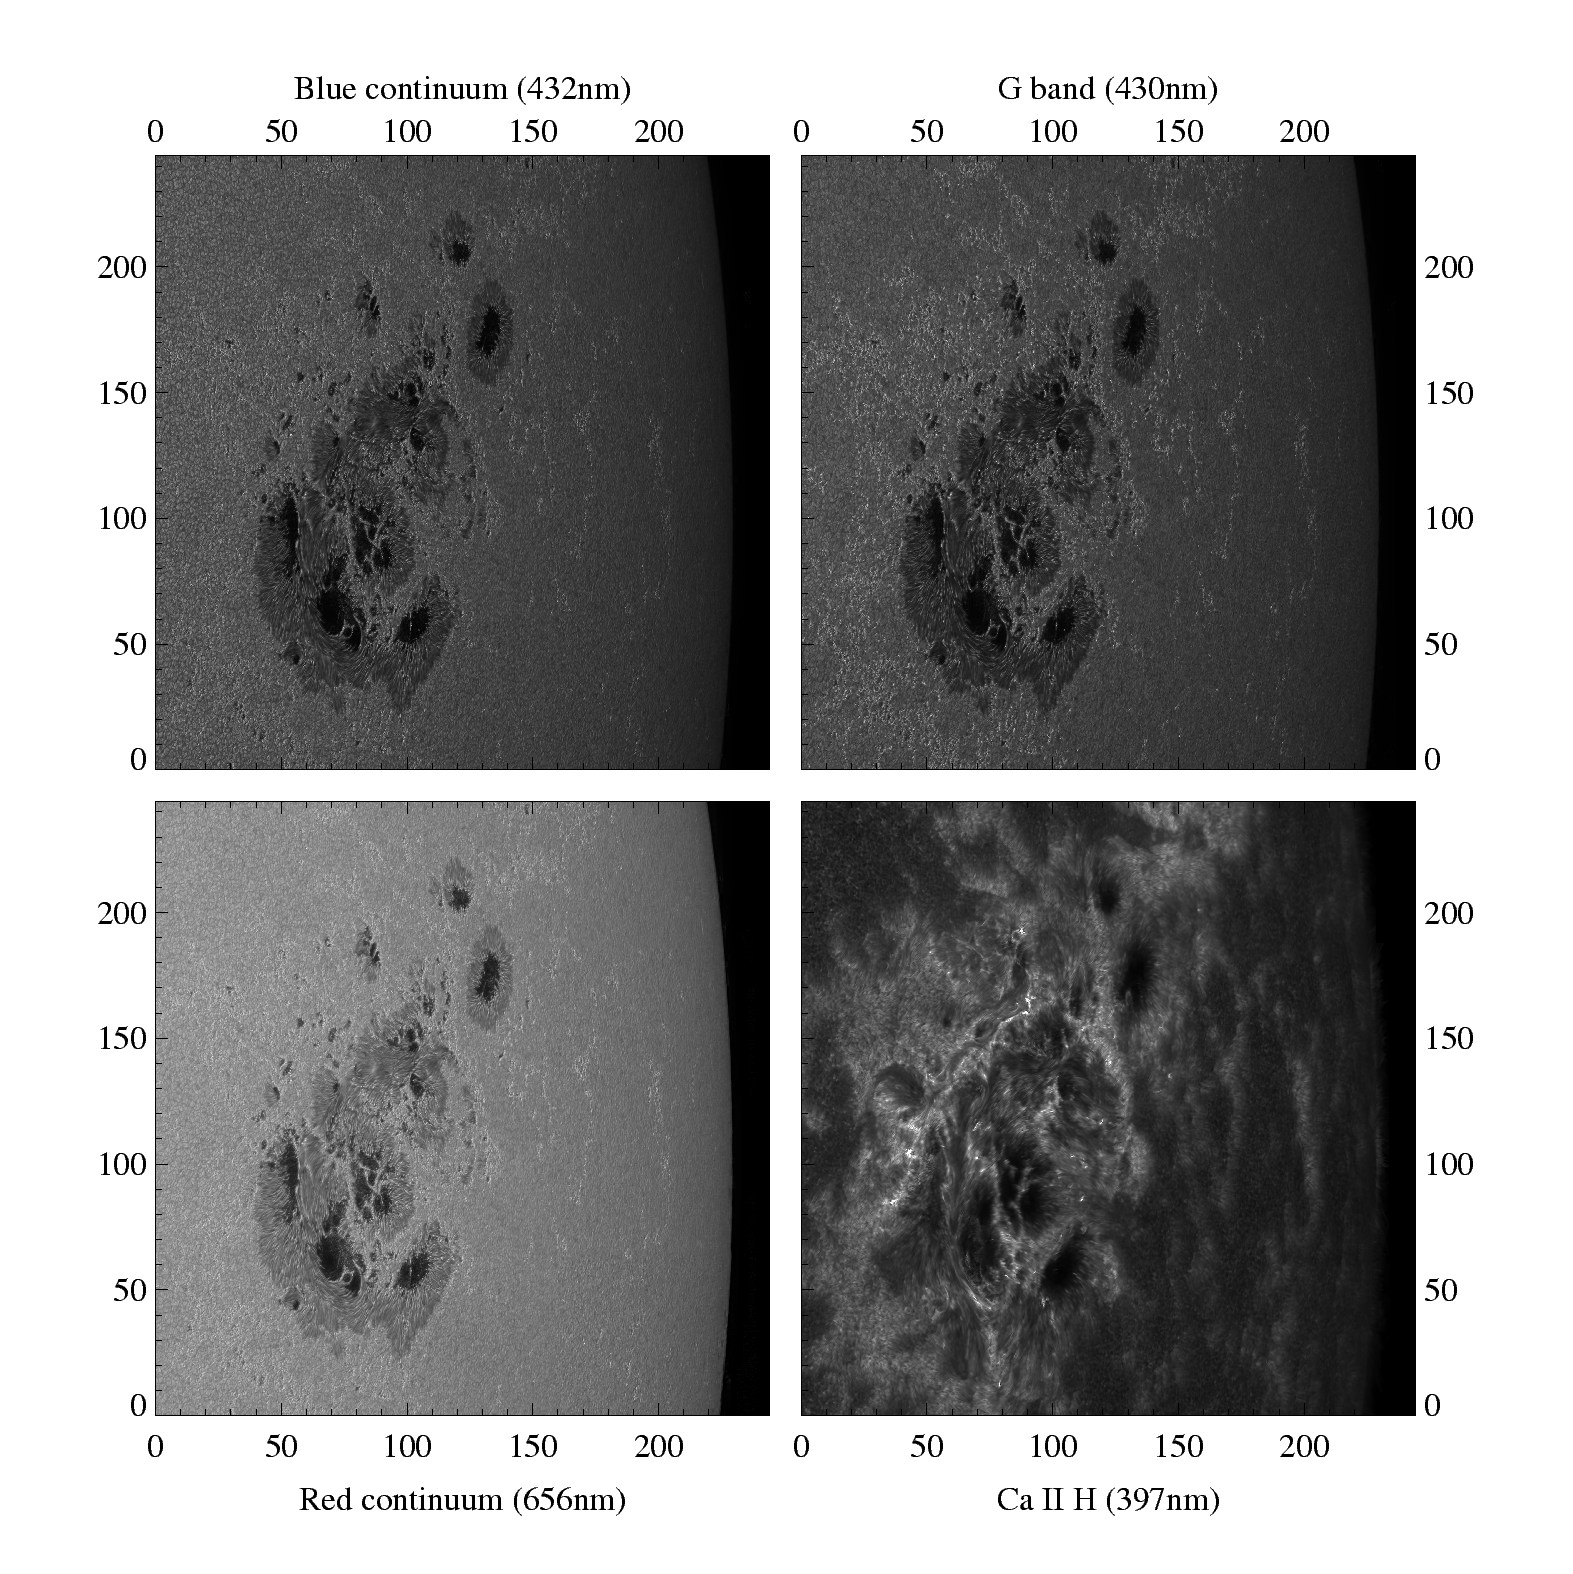
[jpg] AR10486 at four wavelengths
DOT pictures of the sun. Similar to the DOT poster above, but adding images taken at blue and red continuum wavelengths to those in the G band and the Ca II H line. The blue continuum differs from the blue G band through less brightness enhacement of areas containing magnetic elements. The red continuum has smaller sensitivity to temperature differences diminishing the overall contrast.
[.ps] AR10486
Same in PostScript
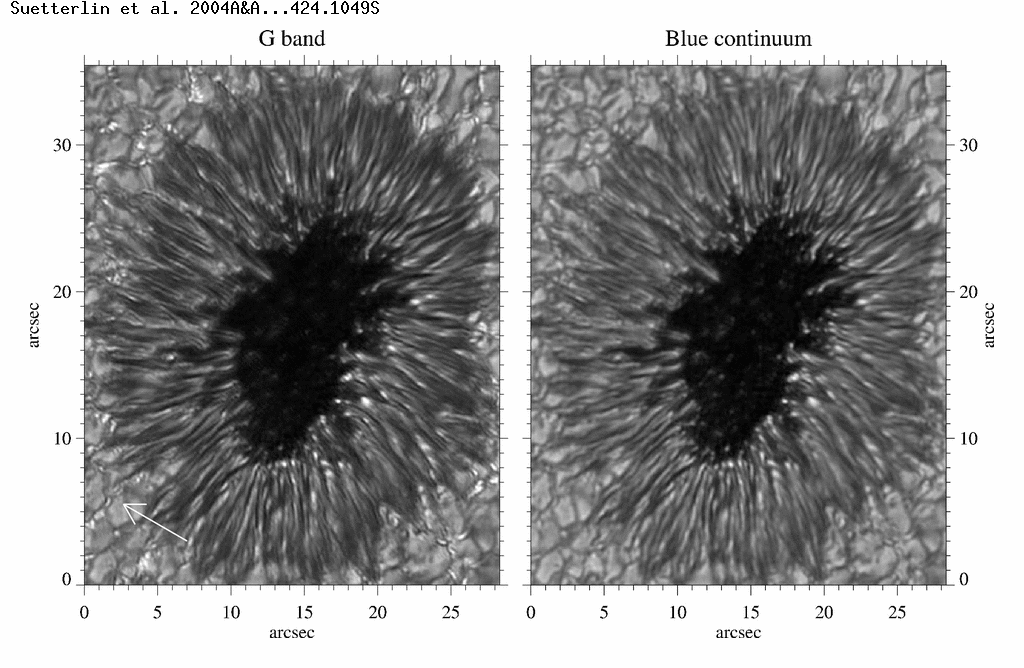
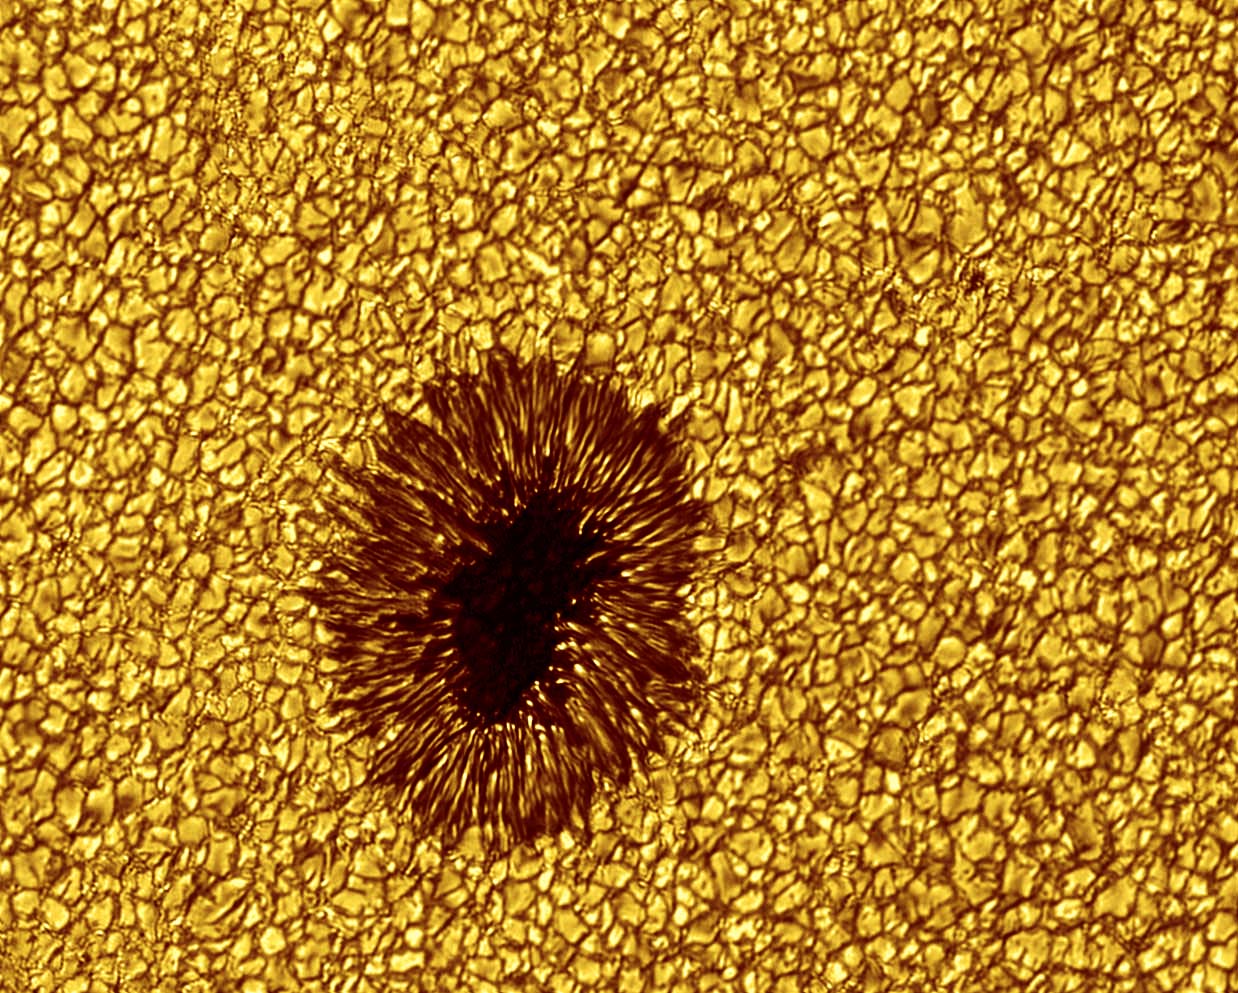
[png] AR10425 sunspot
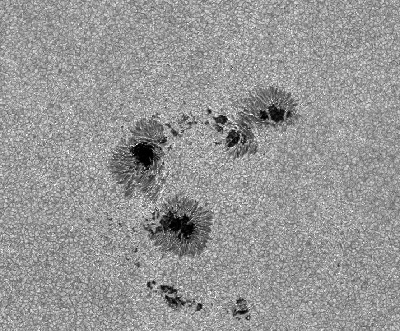
DOT ictures of the sun. Two cut-out sunspot images, taken in the G band (left) and a nearby blue continuum wavelength (Right) on August 9, 2003. Both sample the solar photosphere. The arrow points to solar disk center. Note that the penumbral filaments display dark cores on the disk-center side.
[ps] AR10425 sunspot
Same in PostScript
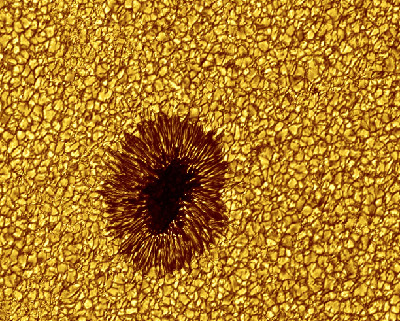
[jpg] AR10425 in G band
DOT picture of the sun. Same sunspot as the lefthand image above, but the full field in color.
[ps] AR10425 in G band
Same in PostScript
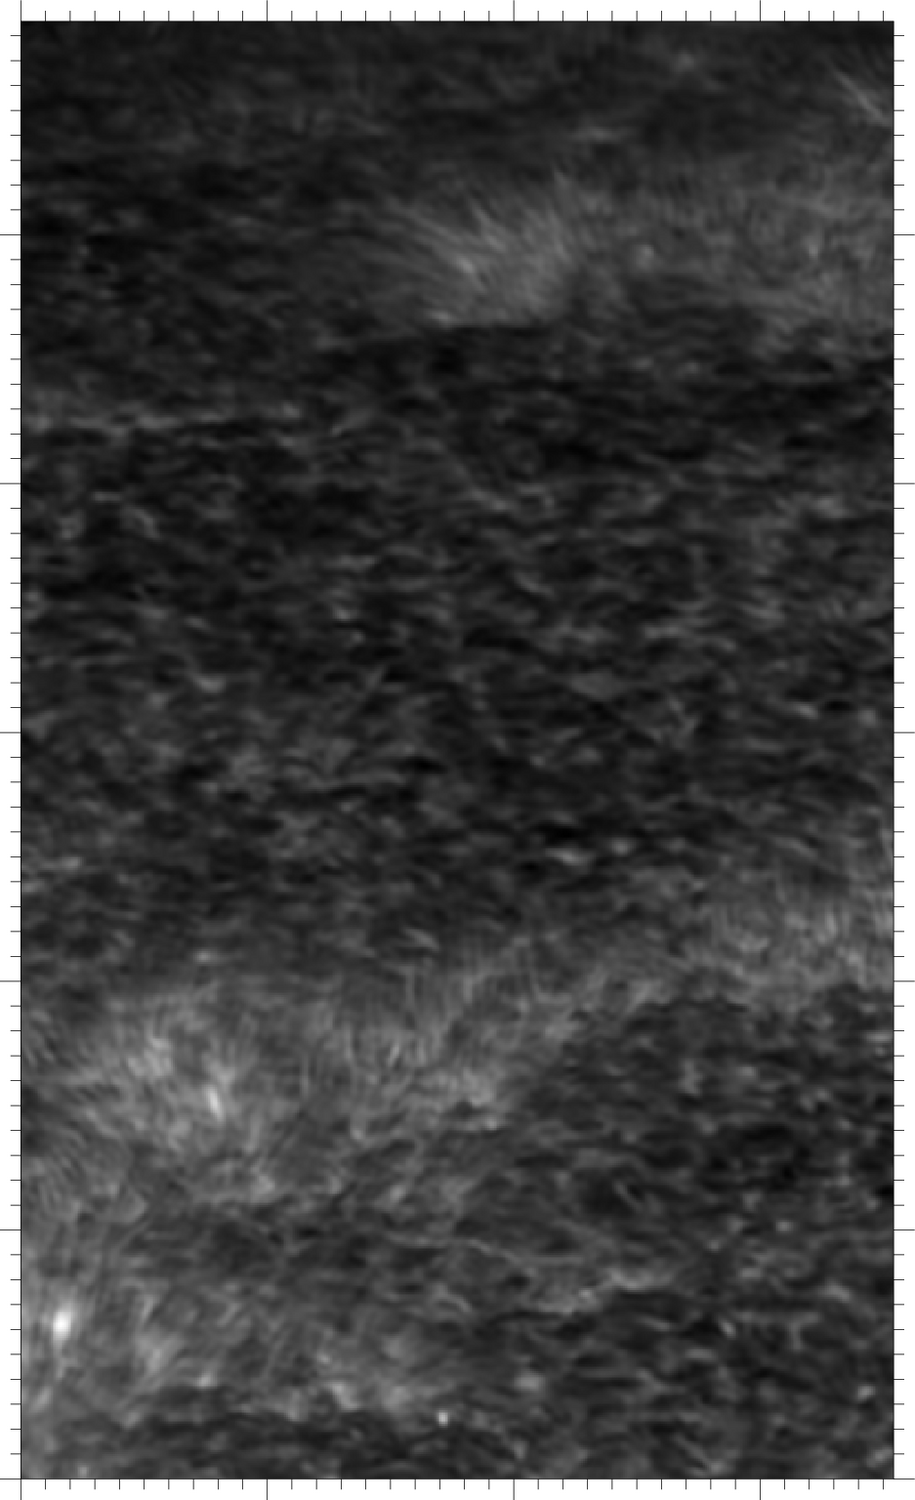
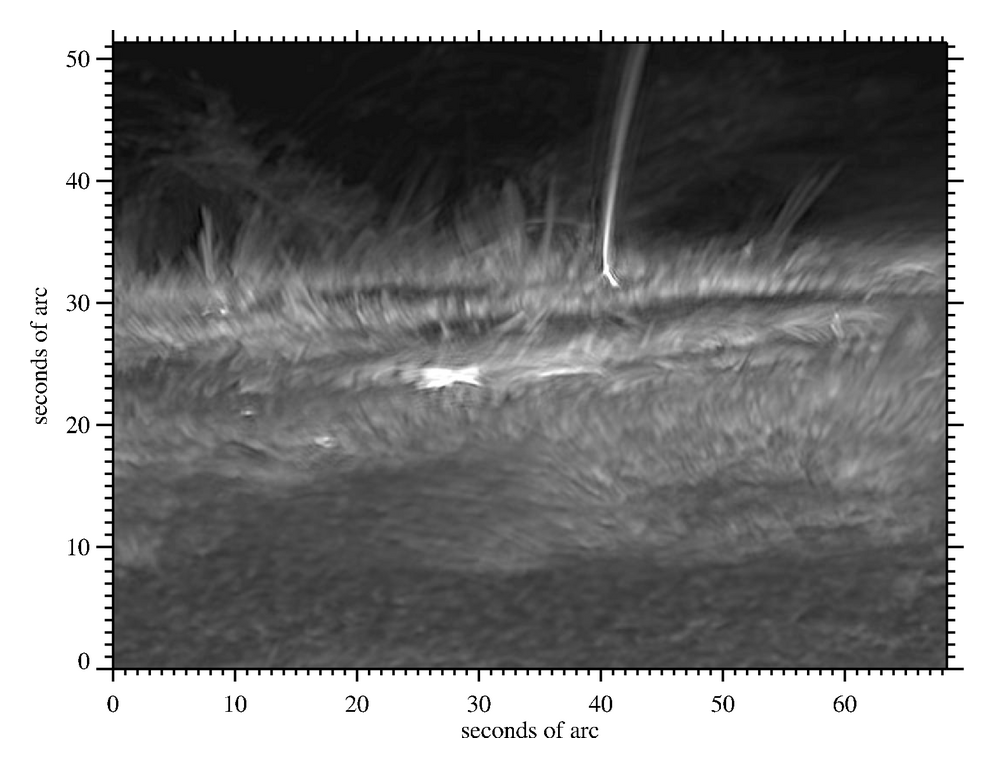
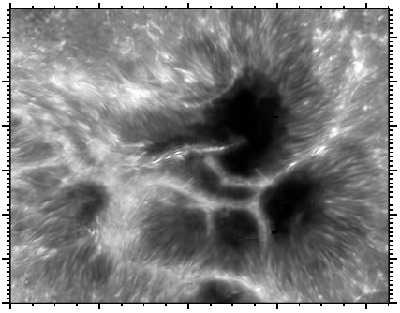
[png] limb in Ca II H
DOT picture of the sun. The solar limb in Ca II H, taken on June 18, 2003. The limb is just above the top. Scale: the tick marks are separated by 1 arcsec. The dark areas show reversed granulation contributed by the innermost line wings. The bright areas are magnetic network. The long thin "straws" sticking out of them are likely to represent magnetic heating.
[ps] limb in Ca II H
Same in PostScript

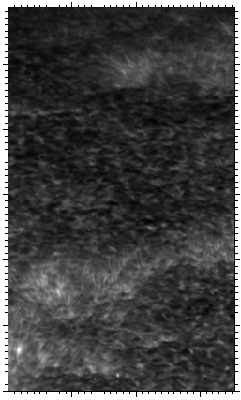
[png] limb in G band and Ca II H
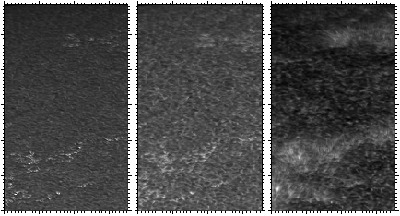
DOT picture of the sun. The solar limb in the G band, the Ca II H wing, and the Ca II H core. The righthand panel is the same as above. Taken on June 18, 2003. The limb is just above the top. Scale: the tick marks are separated by 1 arcsec. The magnetic network, from which the "straws" in the Ca II H core image emanate, shows up as bright patches in the Ca II H wing and the G band.
[ps] limb in G band and Ca II H
Same in PostScript
[png] AR10375 G band and Ca II H
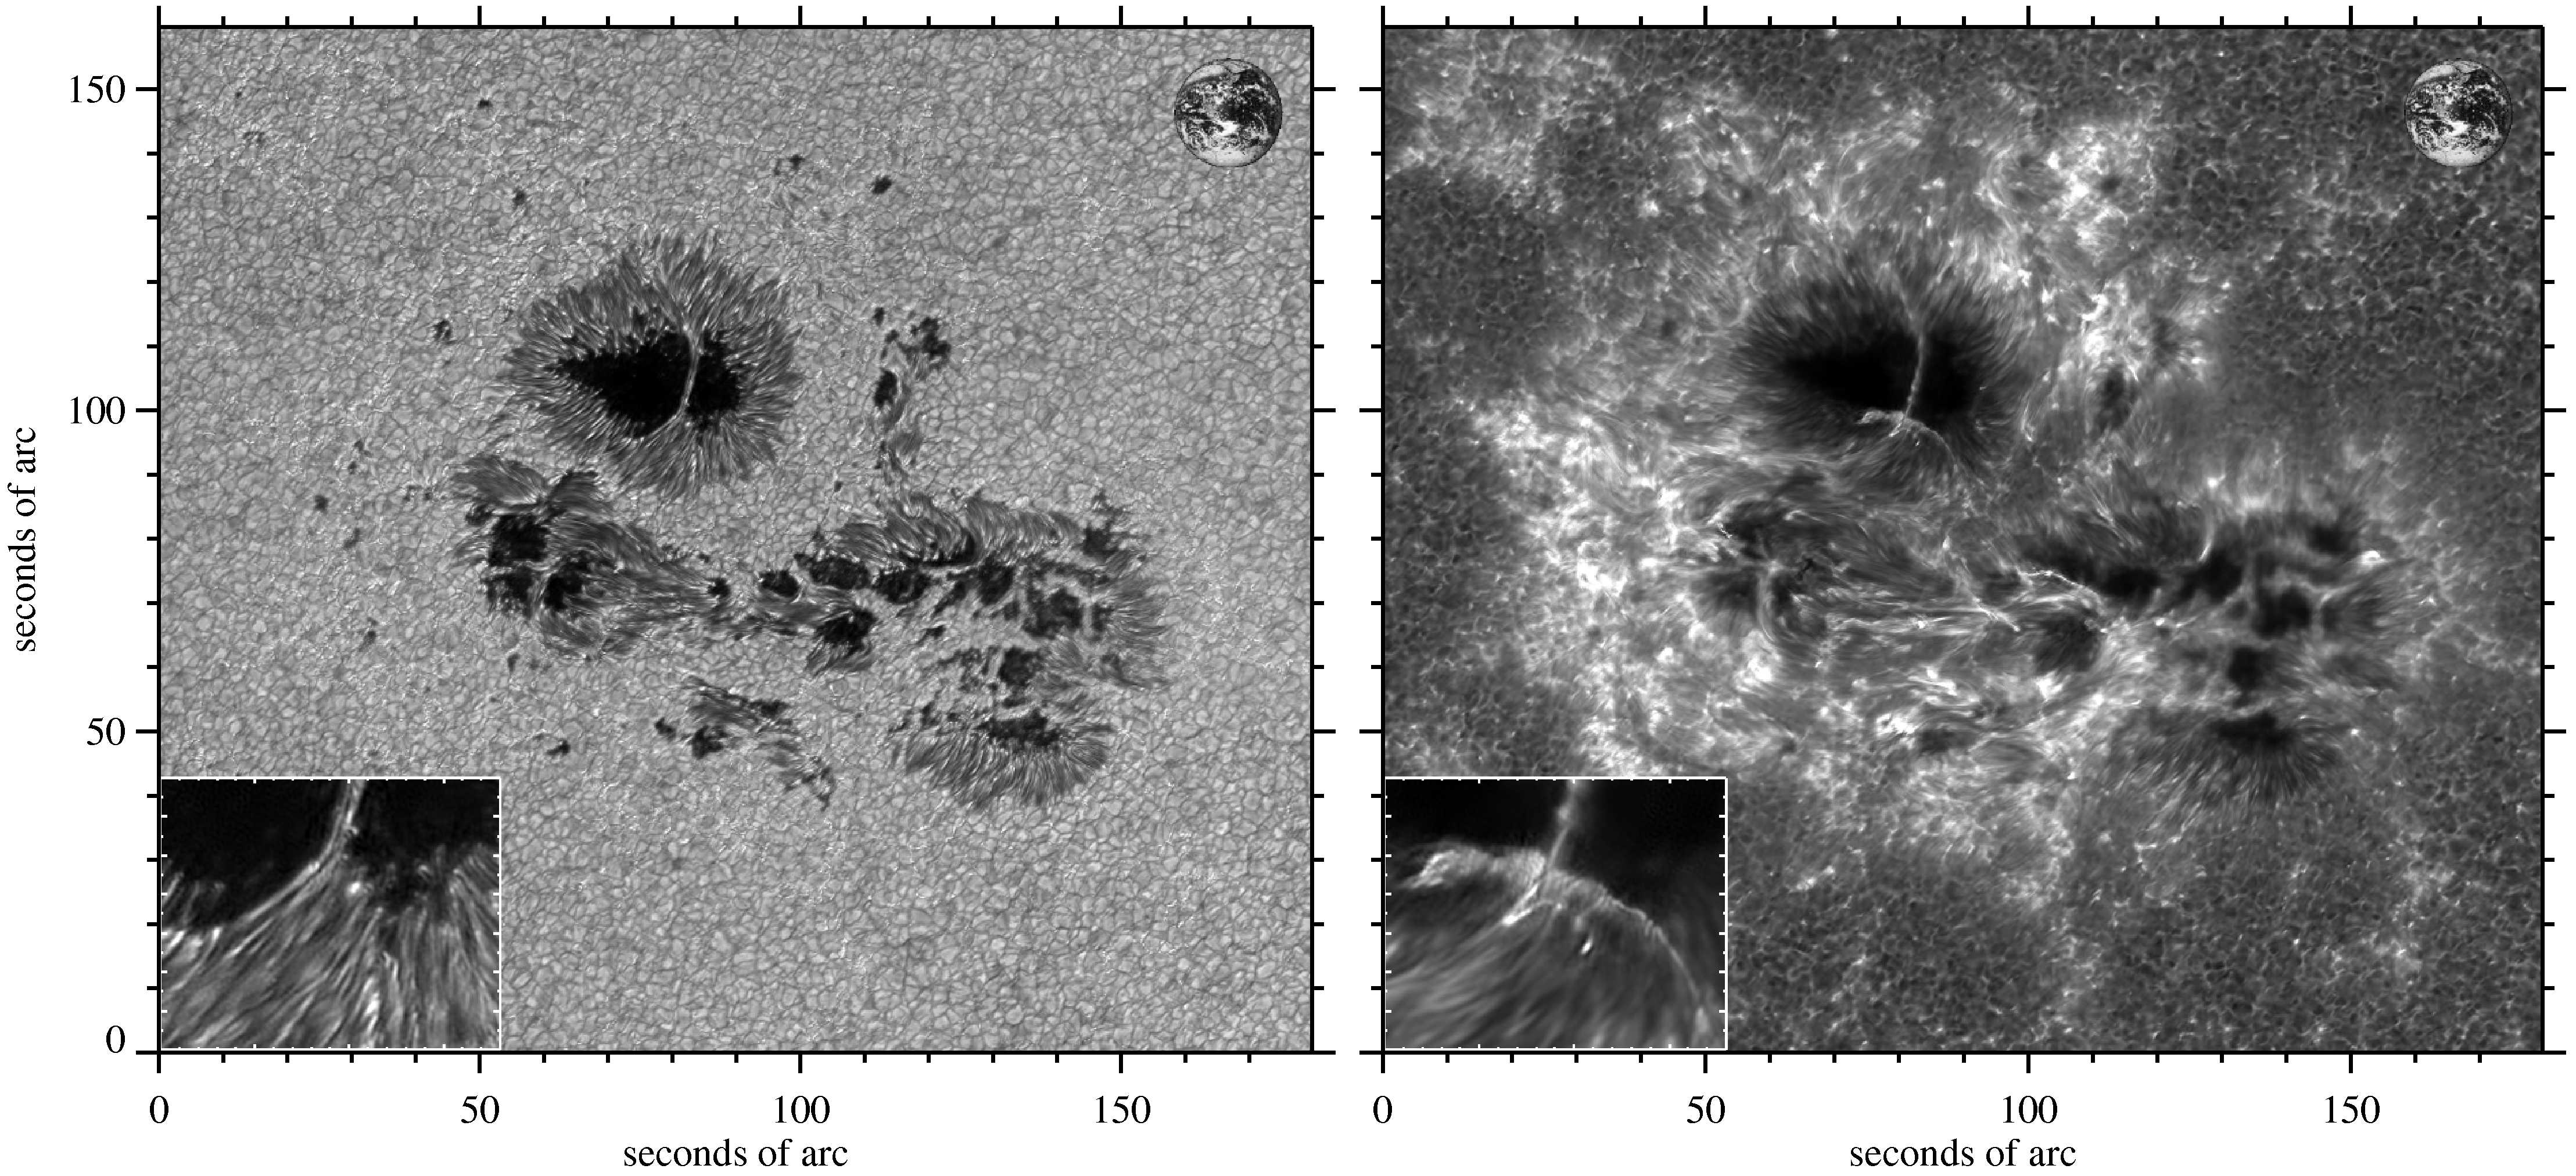
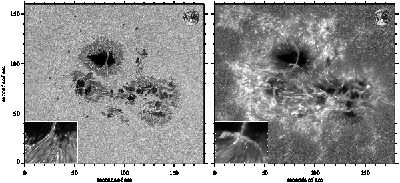
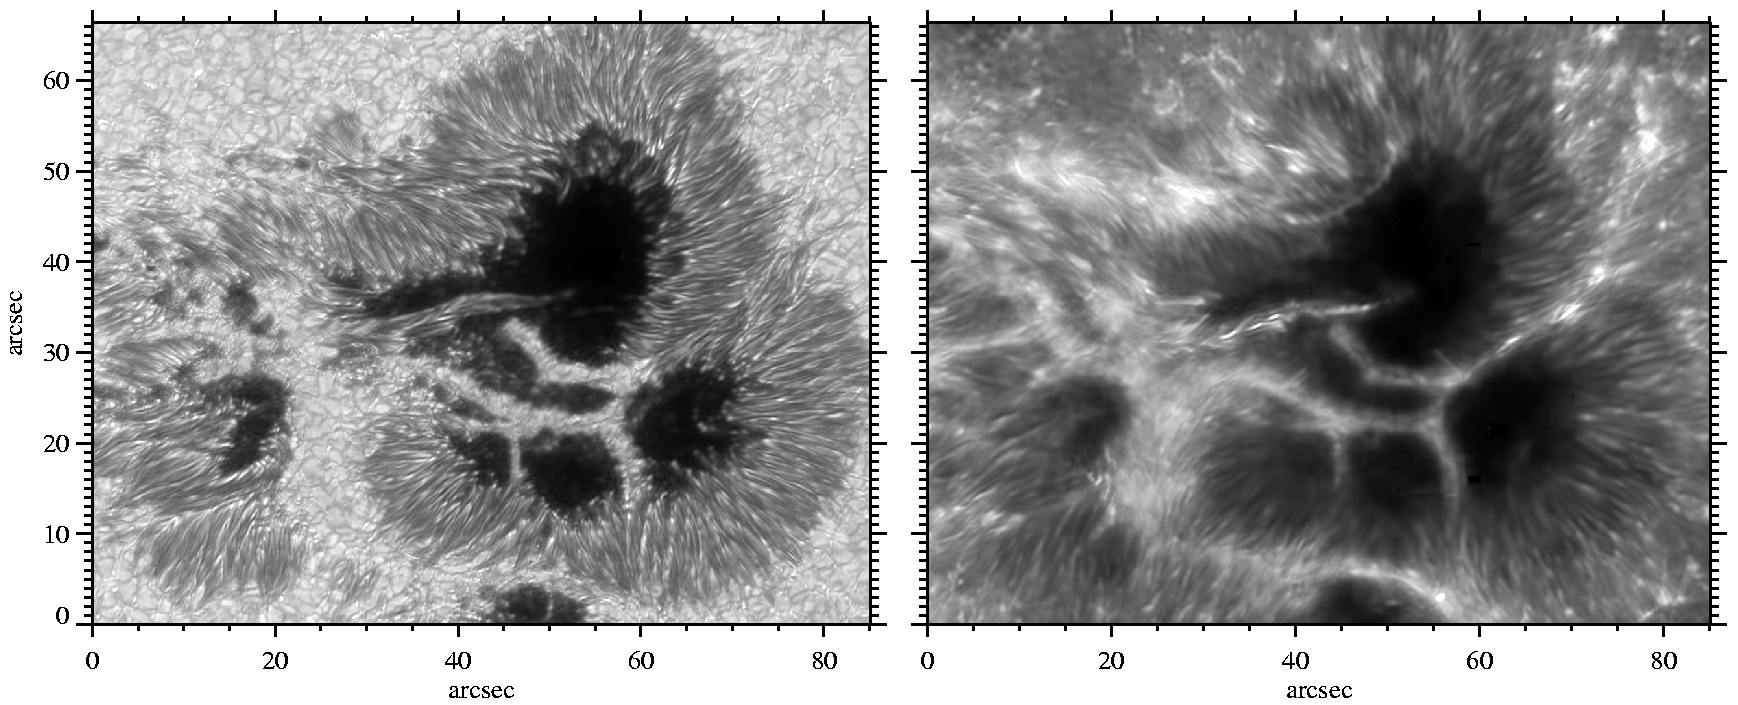
DOT pictures of the sun. Image mosaics of active region AR10375 taken on June 6, 2003, respectively in the photospheric G band (left) and the chromospheric Ca II H line (right). The field measures 250x220 arcsec (1 arcsec is about 725 km on the sun). The small axis ticks are 1 arcsec apart. A scaled photograph of the Earth is inserted at the upper right to show the geometrical scale. There are substantial changes in magnetic field topology between photosphere and chromosphere in all parts of this active region. For example, the inset shows at larger magnification how the light bridge across the umbra has very different lower endpoint structure in the photosphere and chromosphere.
[ps] AR10375 G band and Ca II H
Same in PostScript
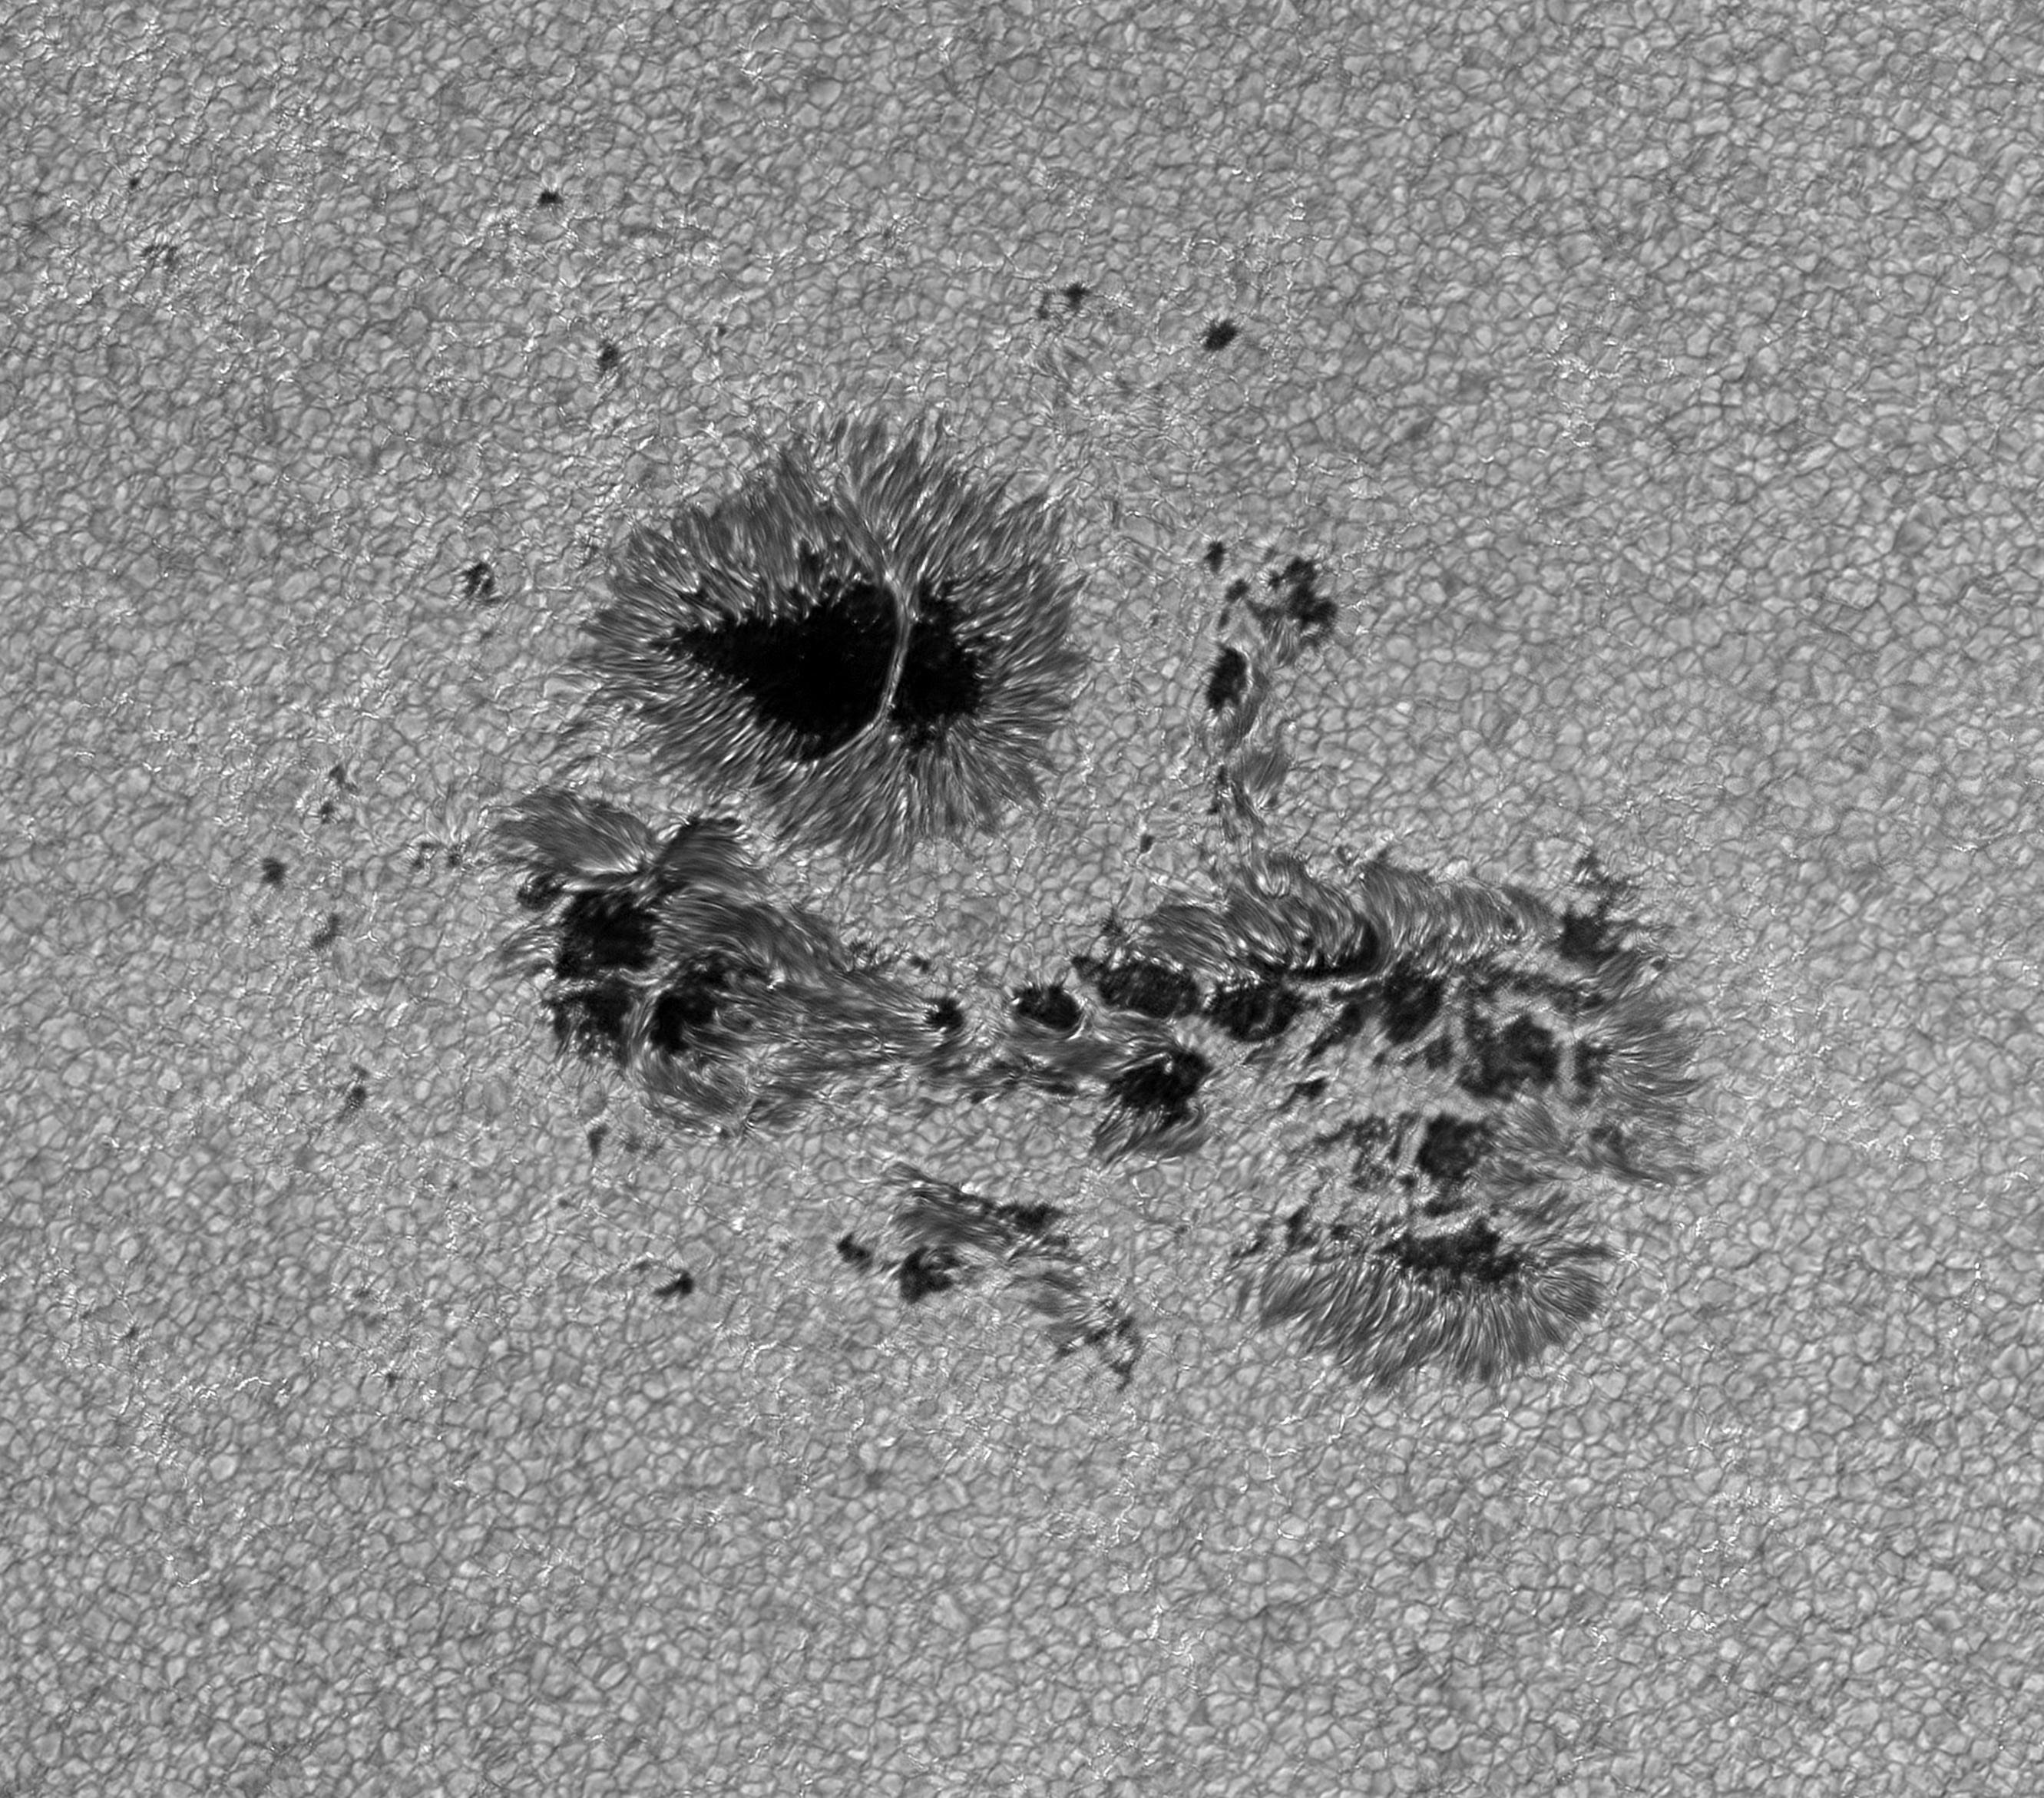
[jpg] AR10375 G band image
Lefthand image of the above duo
[ps] AR10375 G band image
Same in PostScript
[jpg] AR10375 Ca II H image
Righthand image of the above duo
[ps] AR10375 Ca II H image
Same in PostScript
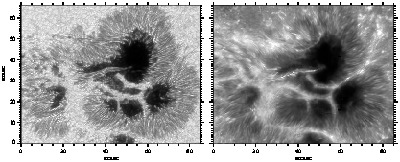
[png] Sunspot in G band and Ca IIH
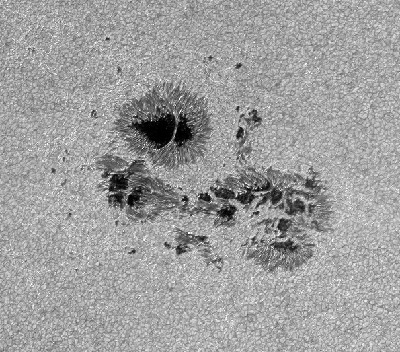
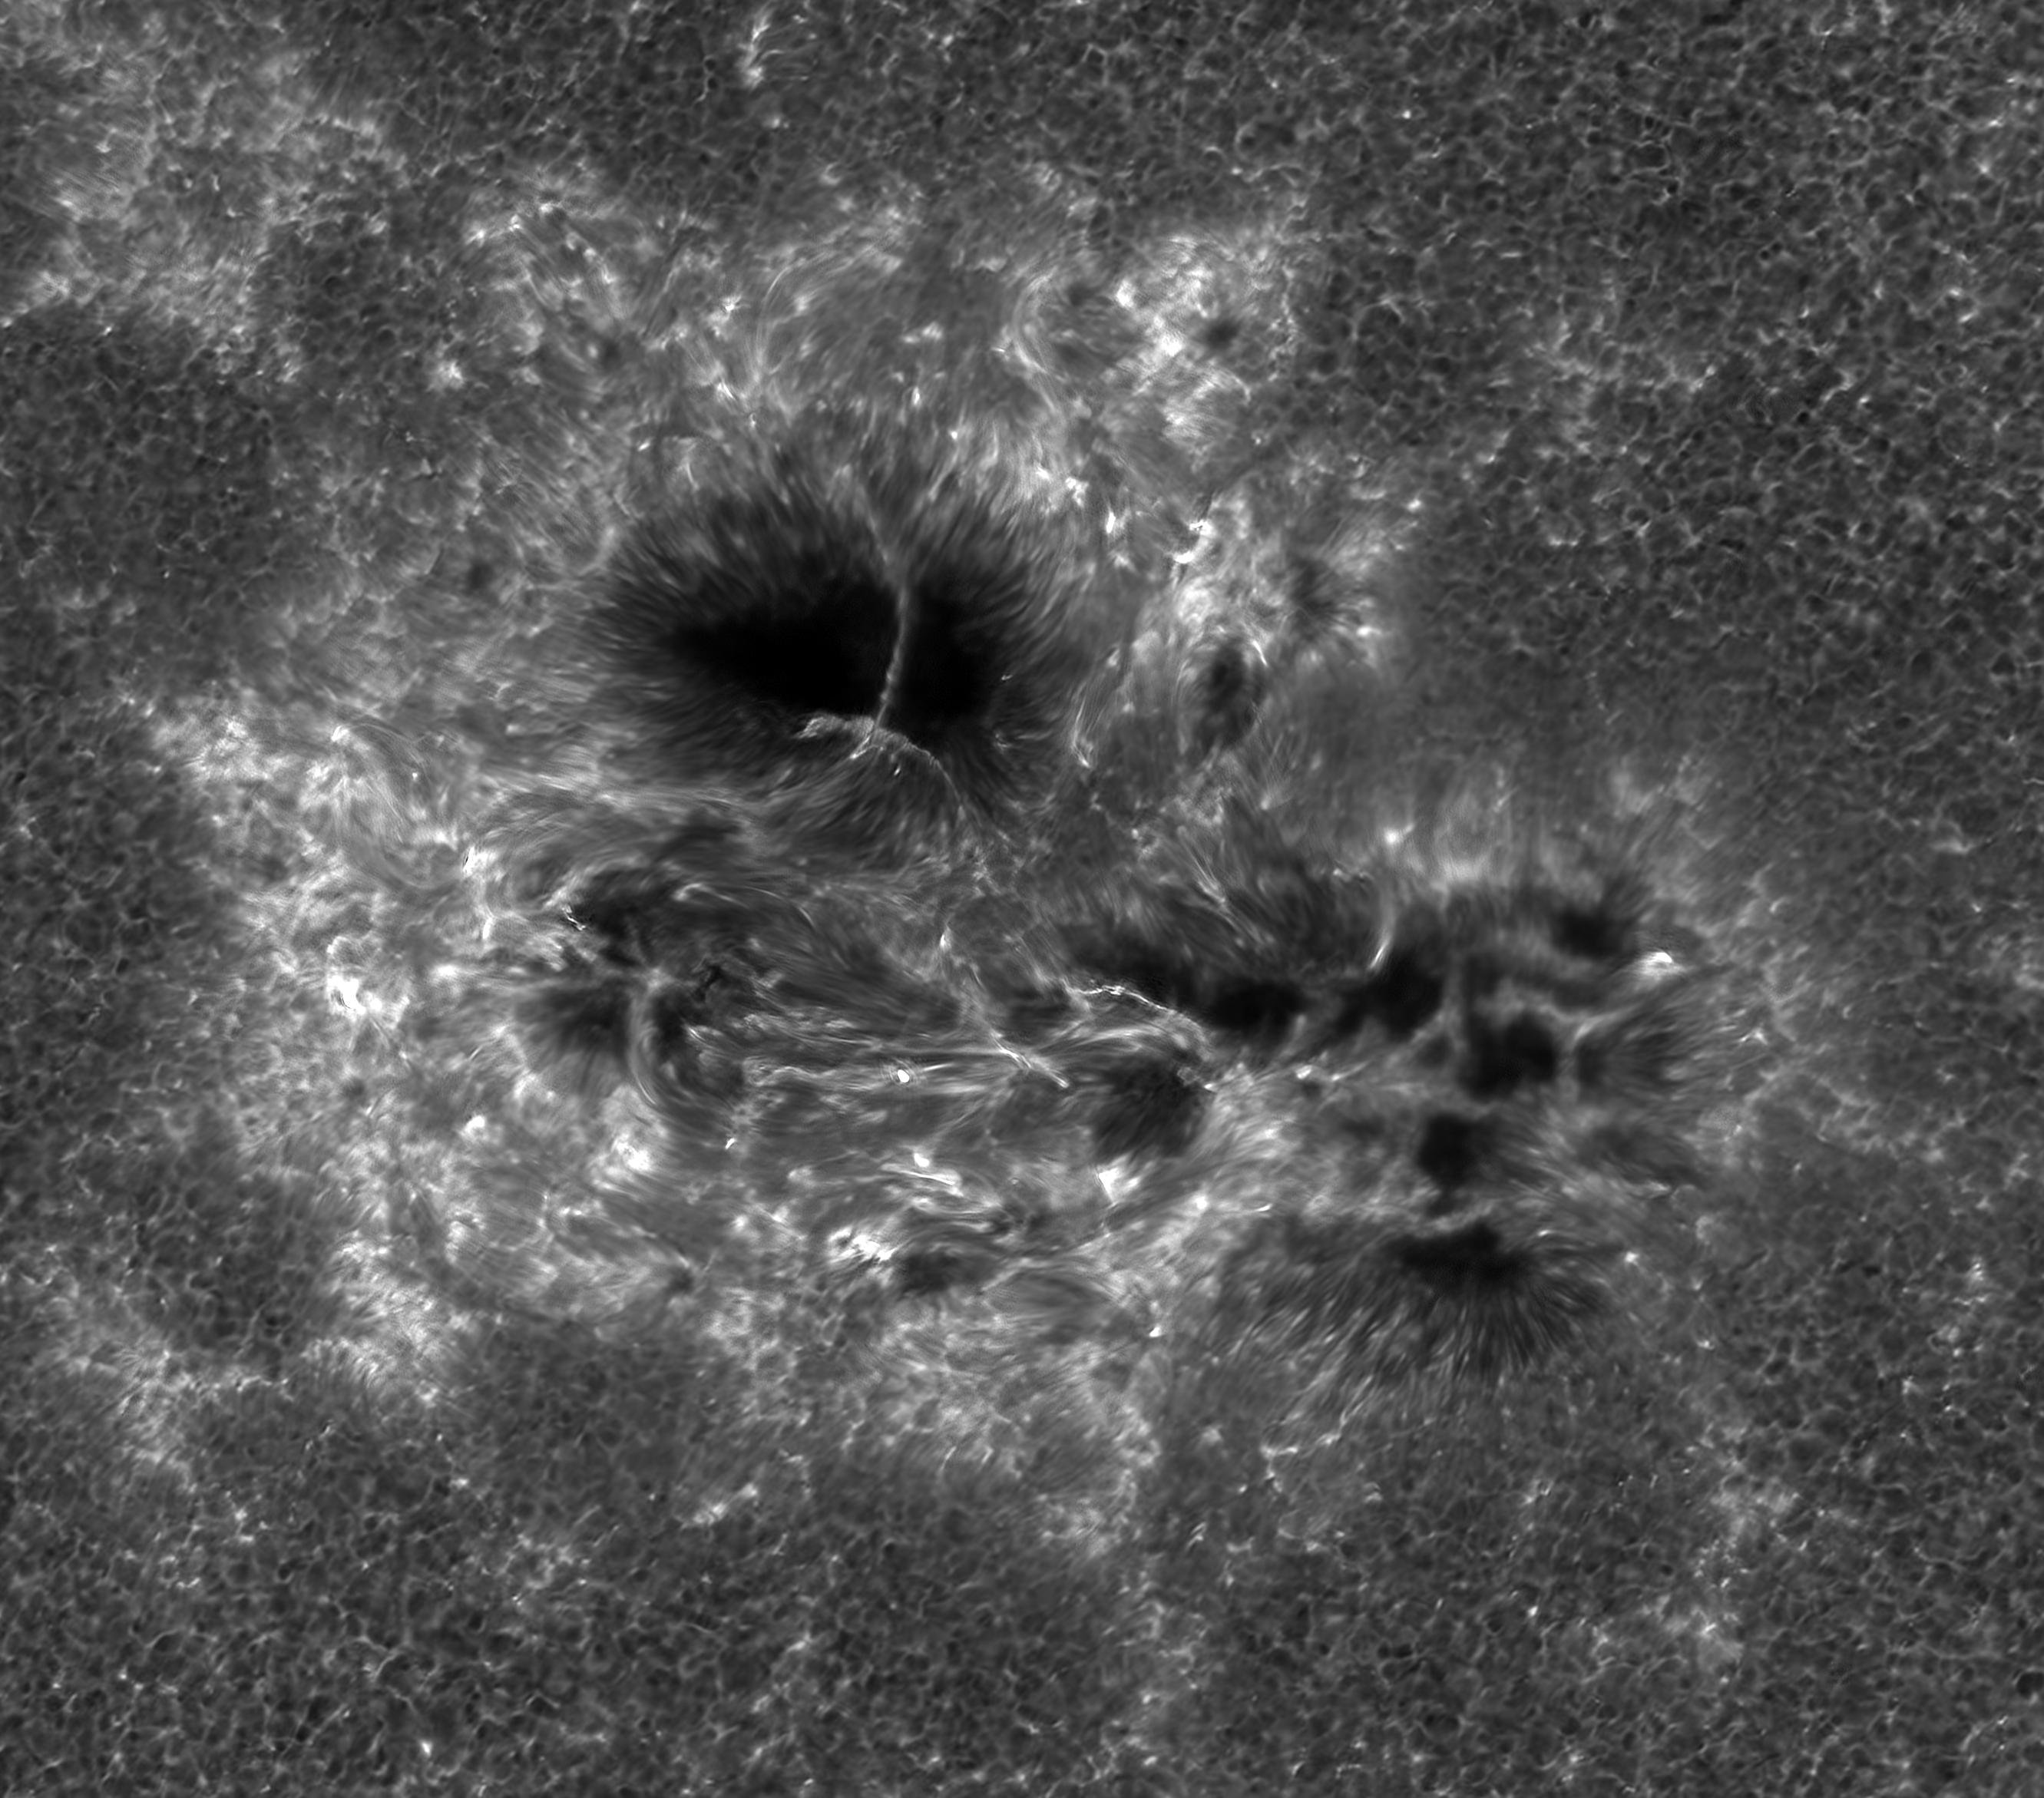
Images in the G band (left) and the Ca II H line (right) of a mature, complex sunspot taken on May 1, 2003.
[ps] Sunspot in G band and Ca IIH
Same in PostScript
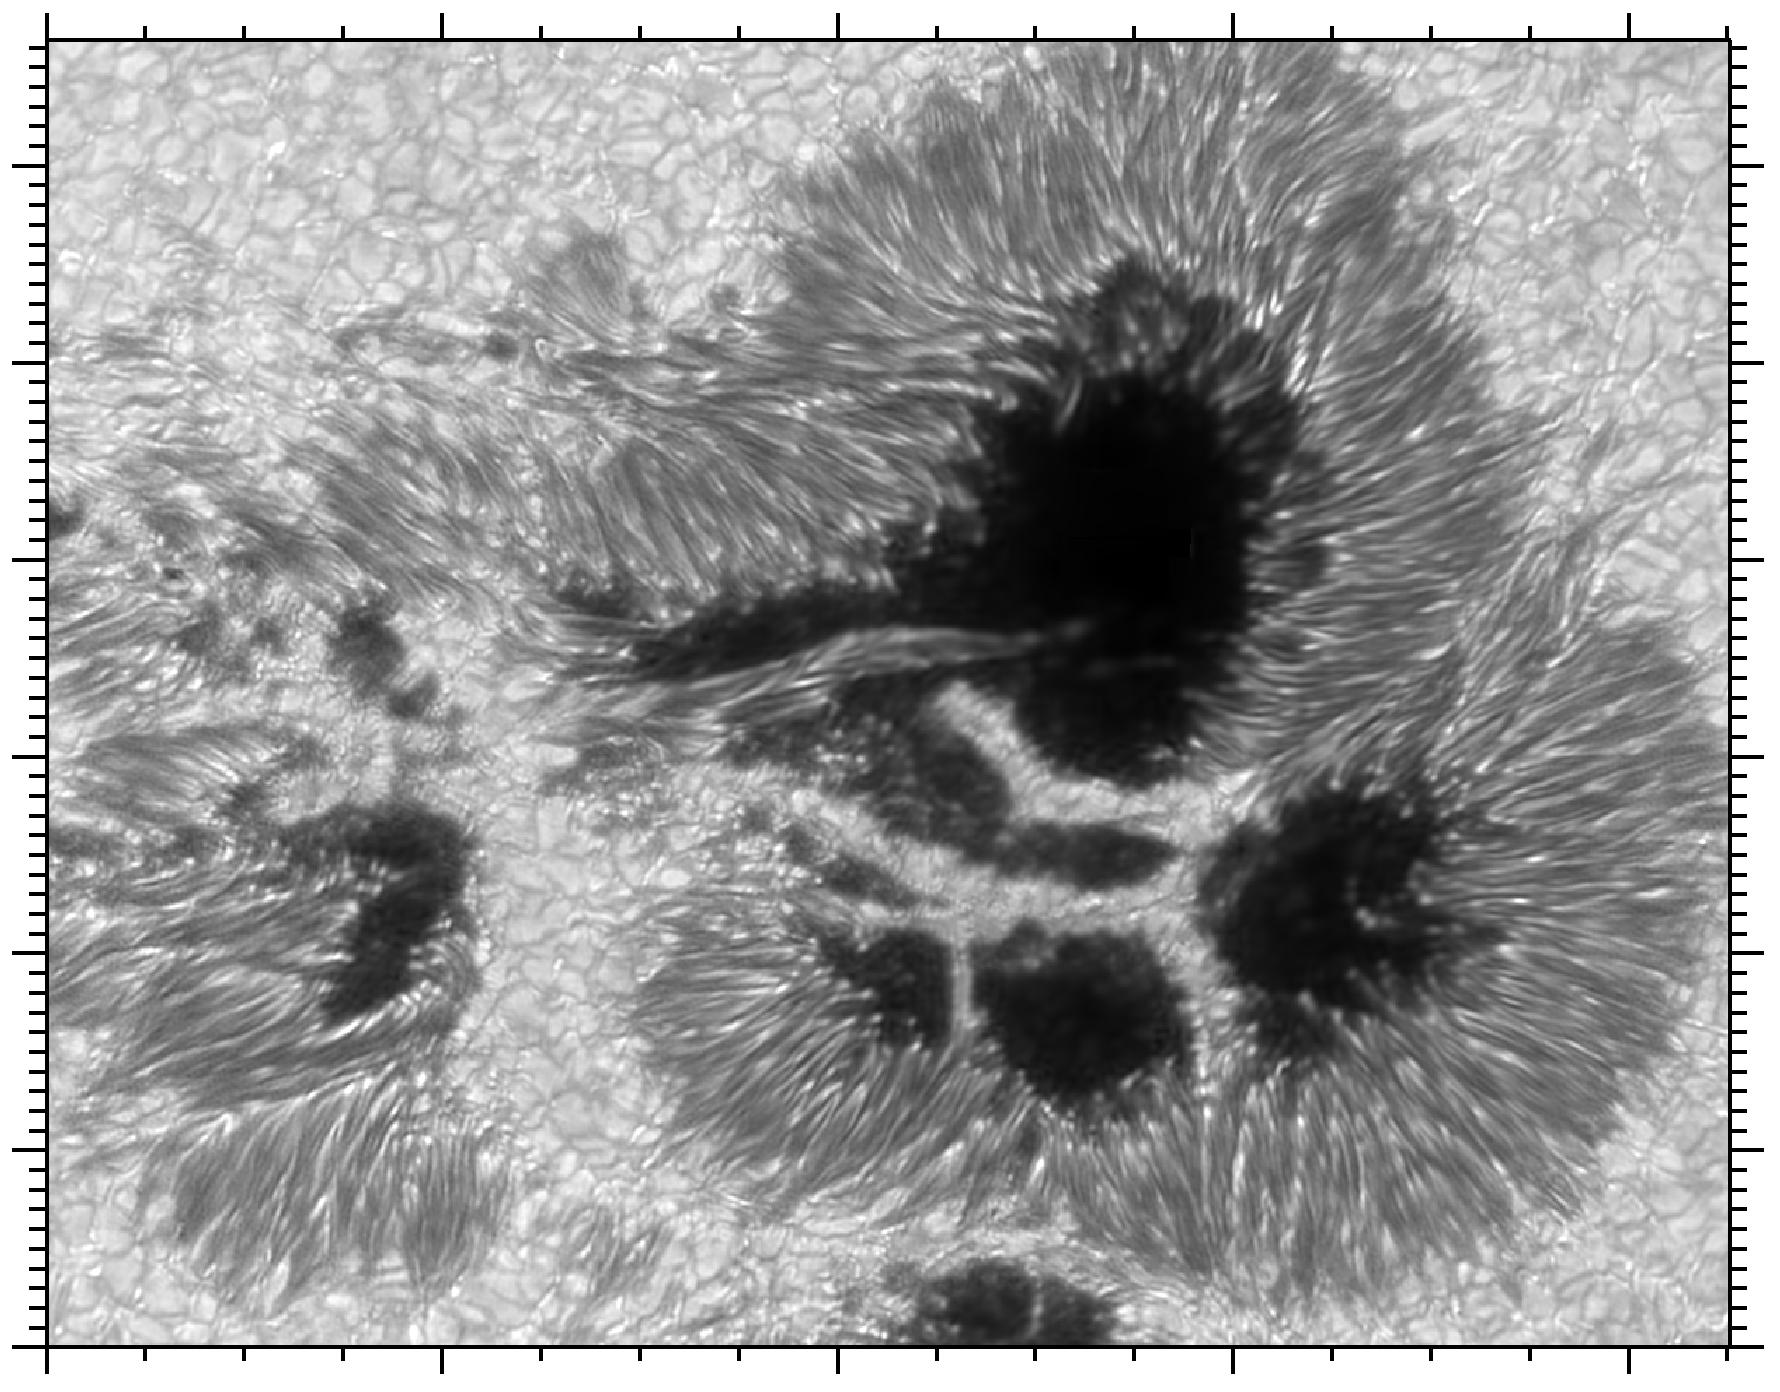
[jpg] Sunspot in the G band
Lefthand image of the above duo
[ps] Sunspot in G band
Same in PostScript
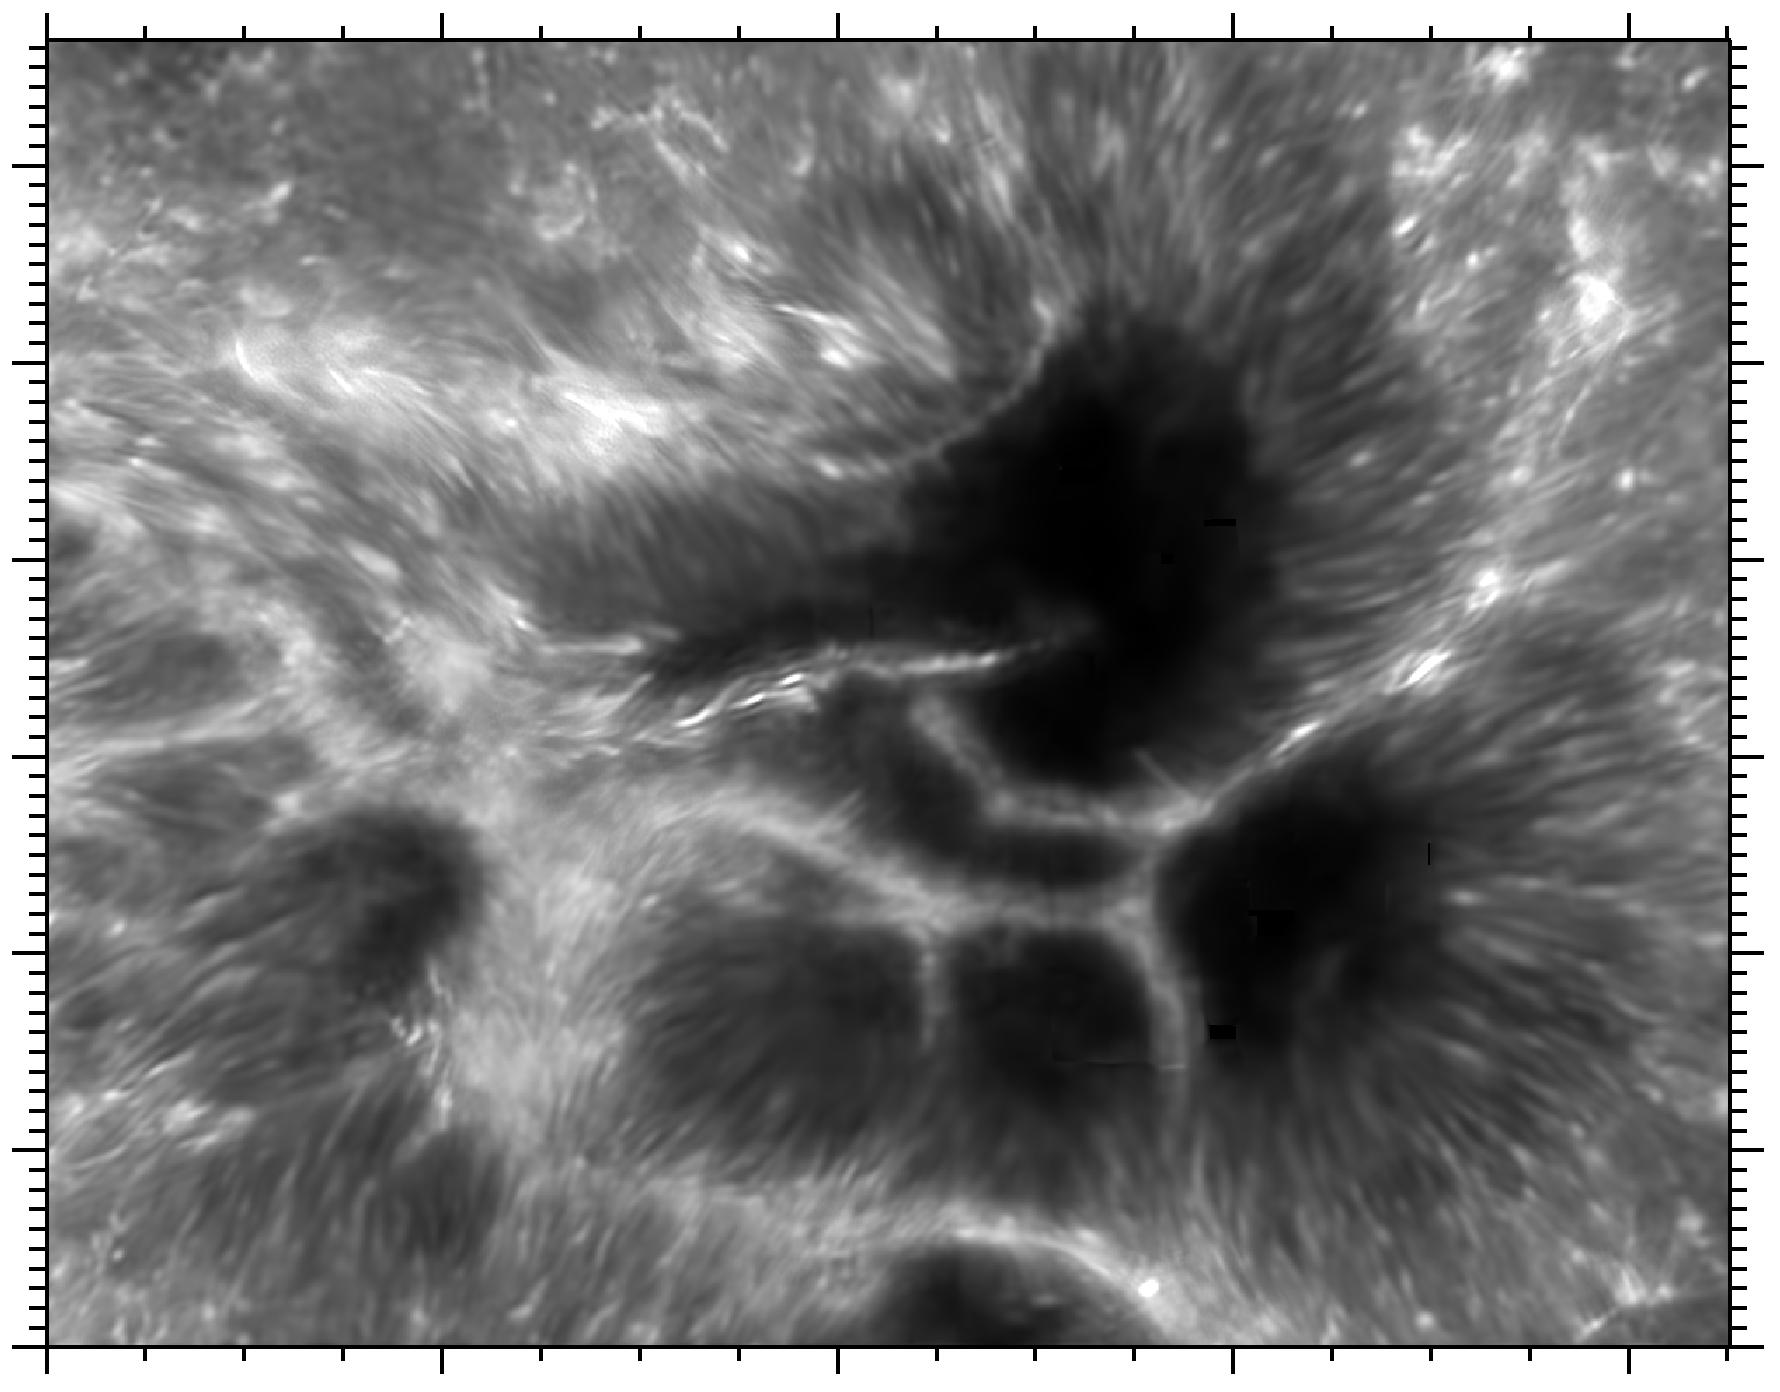
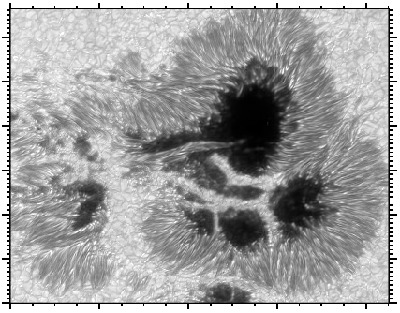
[jpg] Sunspot in Ca II H
Righthand image of the above duo
[ps] Sunspot in Ca II H
Same in PostScript
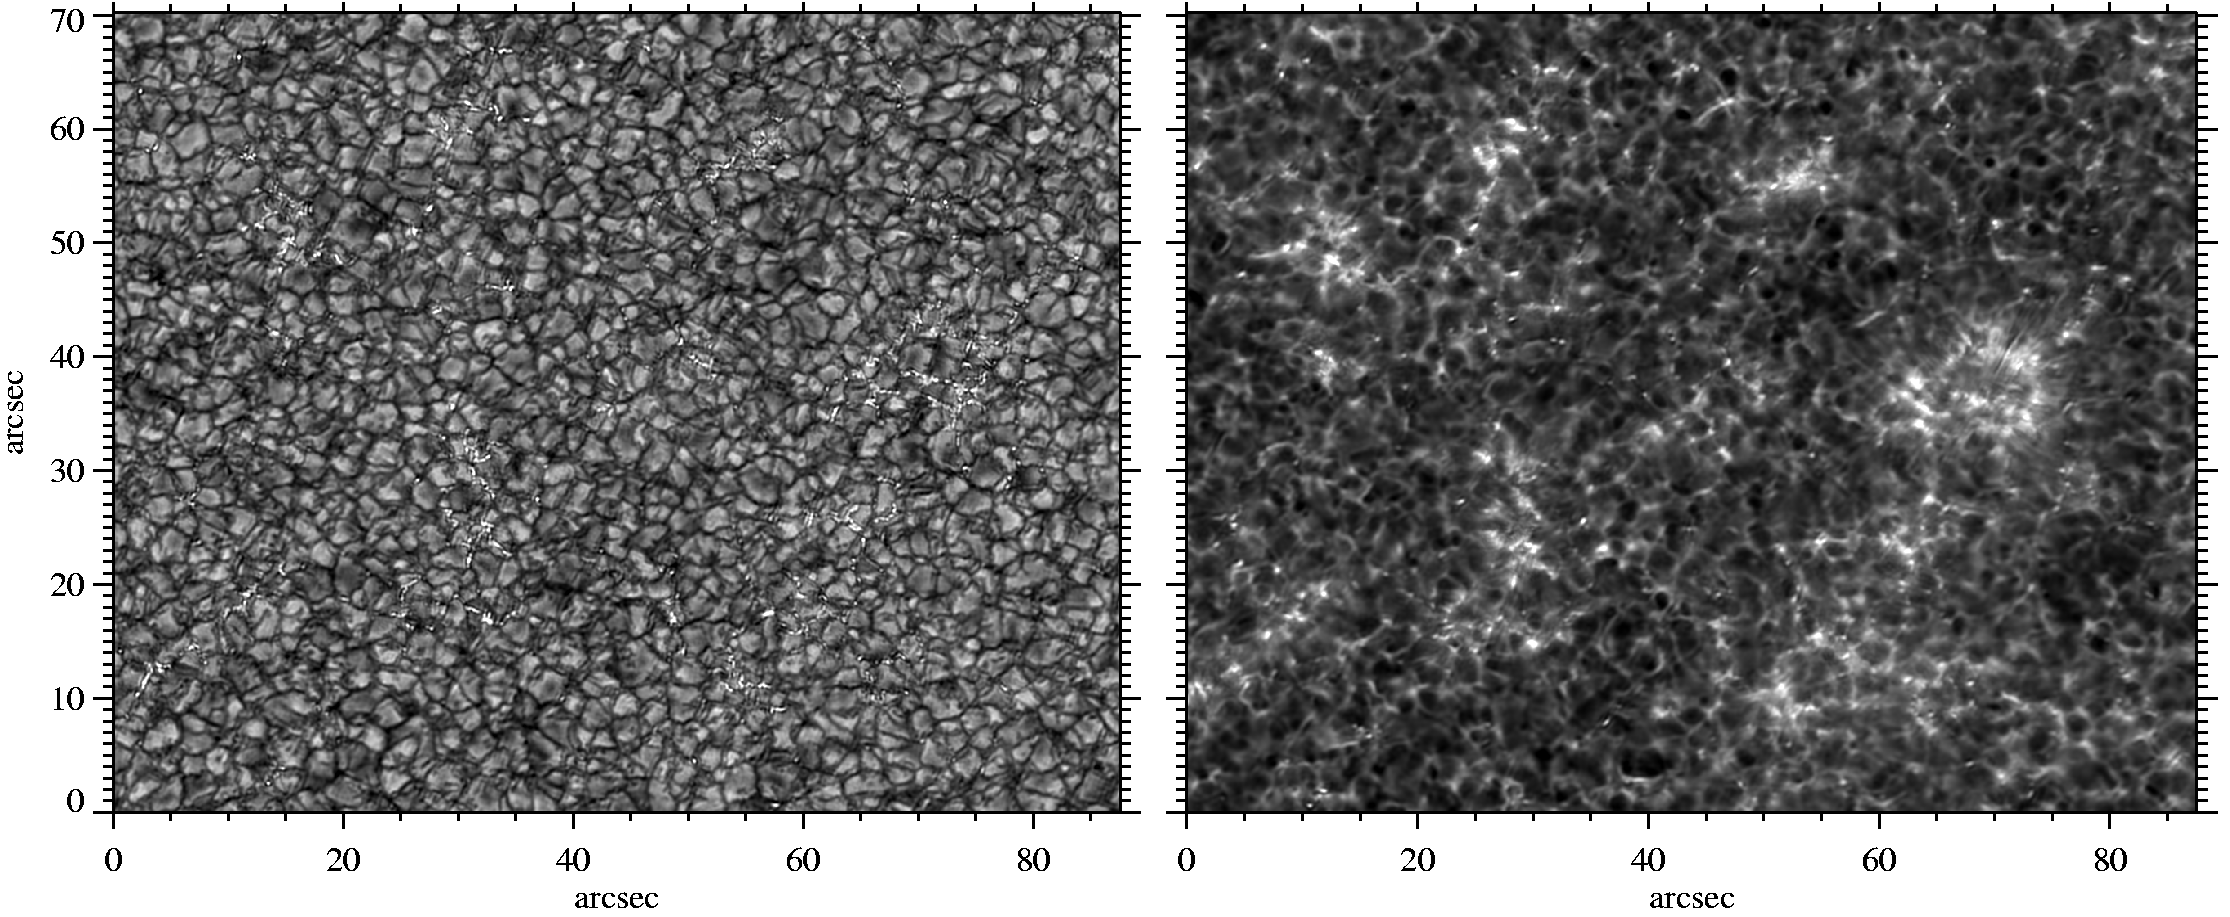
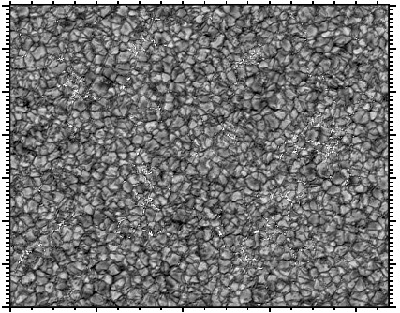
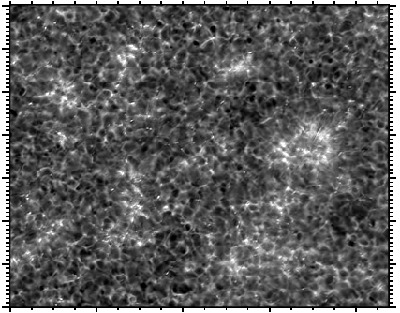
[png] Quiet ar..n G band and Ca II H
DOT pictures of the sun. Quiet solar area in the G band (left) and in Ca II H (right). The photosphere sampled by the G band shows bright granules, dark intergranular lanes, and tiny very bright magnetic elements. The granulation is the surface manifestation of solar convection. Granules are upwellings of hotter gas of which the rising motion gets stopped through the departure of the electromagnetic radiation that we observe as sunshine. The dark lanes are the places where the cooled gas sinks bank. In these lanes bright points mark the presence of magnetic elements. They are relatively empty because the magnetic pressure oushes the gas out. One therefore views deeper into these elements, and observes the hot gas below the granulation surface. The Ca II H image at right samples the low chromosphere, about 400 km higher up. It is brighter where clusters of magnetic elements occur. These patches of enhanced brightness outline the chromospheric network, which coincides with the magnetic network constituted by the magnetic elements in the photosphere. The granulation pattern is partially reversed in the low chromosphere: at this height the gas above the lanes tends to be brighter than the gas above the granules.
[ps] Quiet area in G band and Ca II H
Same in PostScript
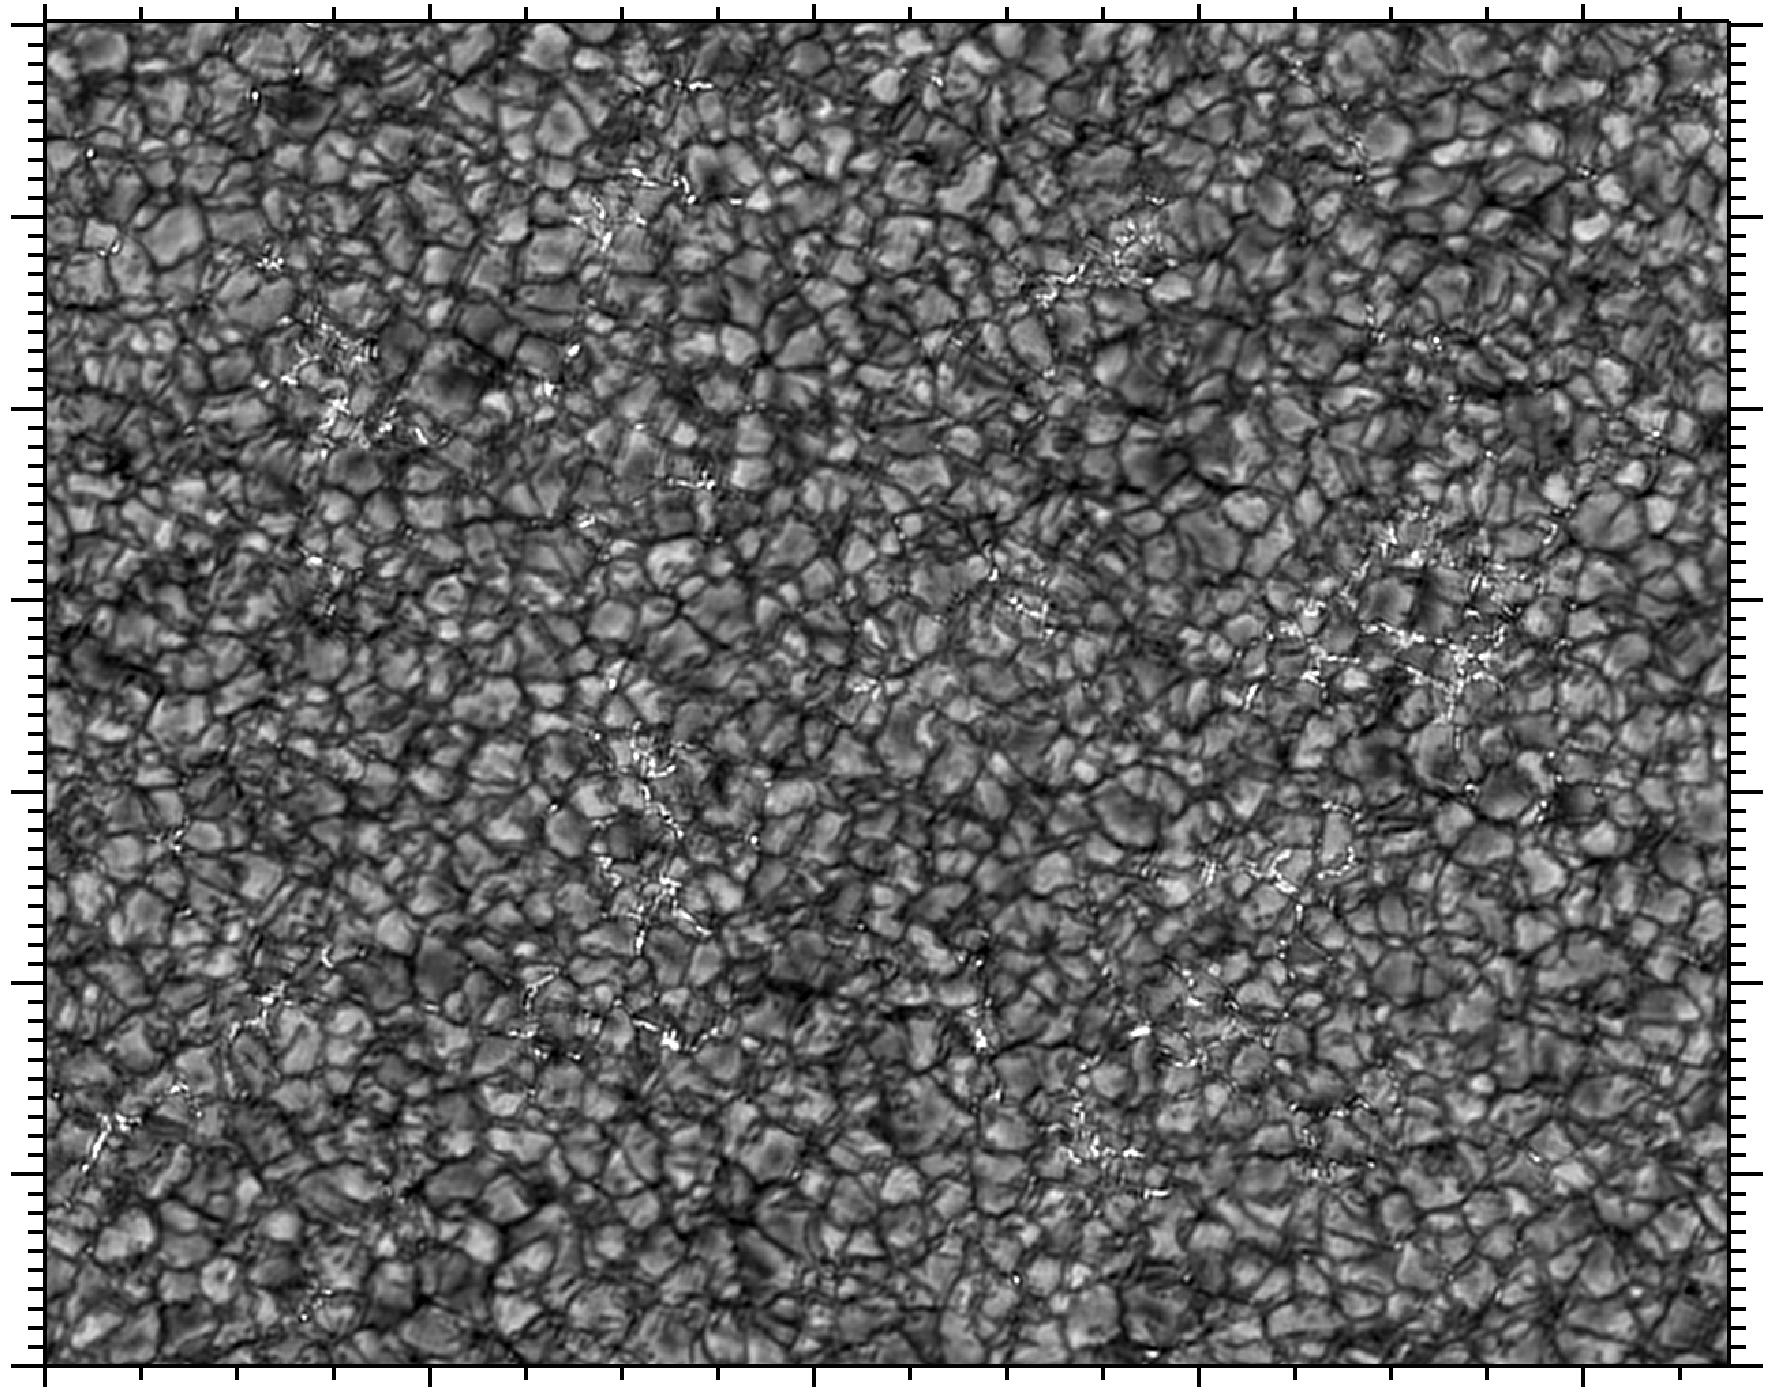
[jpg] Quiet area in G band
Lefthand image of the above duo
[ps] Quiet area in the G band
Same in PostScript
[jpg] Quiet area in Ca II H
Righthand image of the above duo
[ps] Quiet area in Ca II H
Same in PostScript
[png] AR10019 in G band
DOT picture of the sun. Mosaic of active region AR10019 taken on July 3, 2002 in the G band.
[ps] AR10019 in G band
Same on PostScript
[png] AR10910 in G band
Same in PostScript
[png] AR10910 in Ca II H
Same in PostScript
[png] AR10910 in Halpha
Same in PostScript
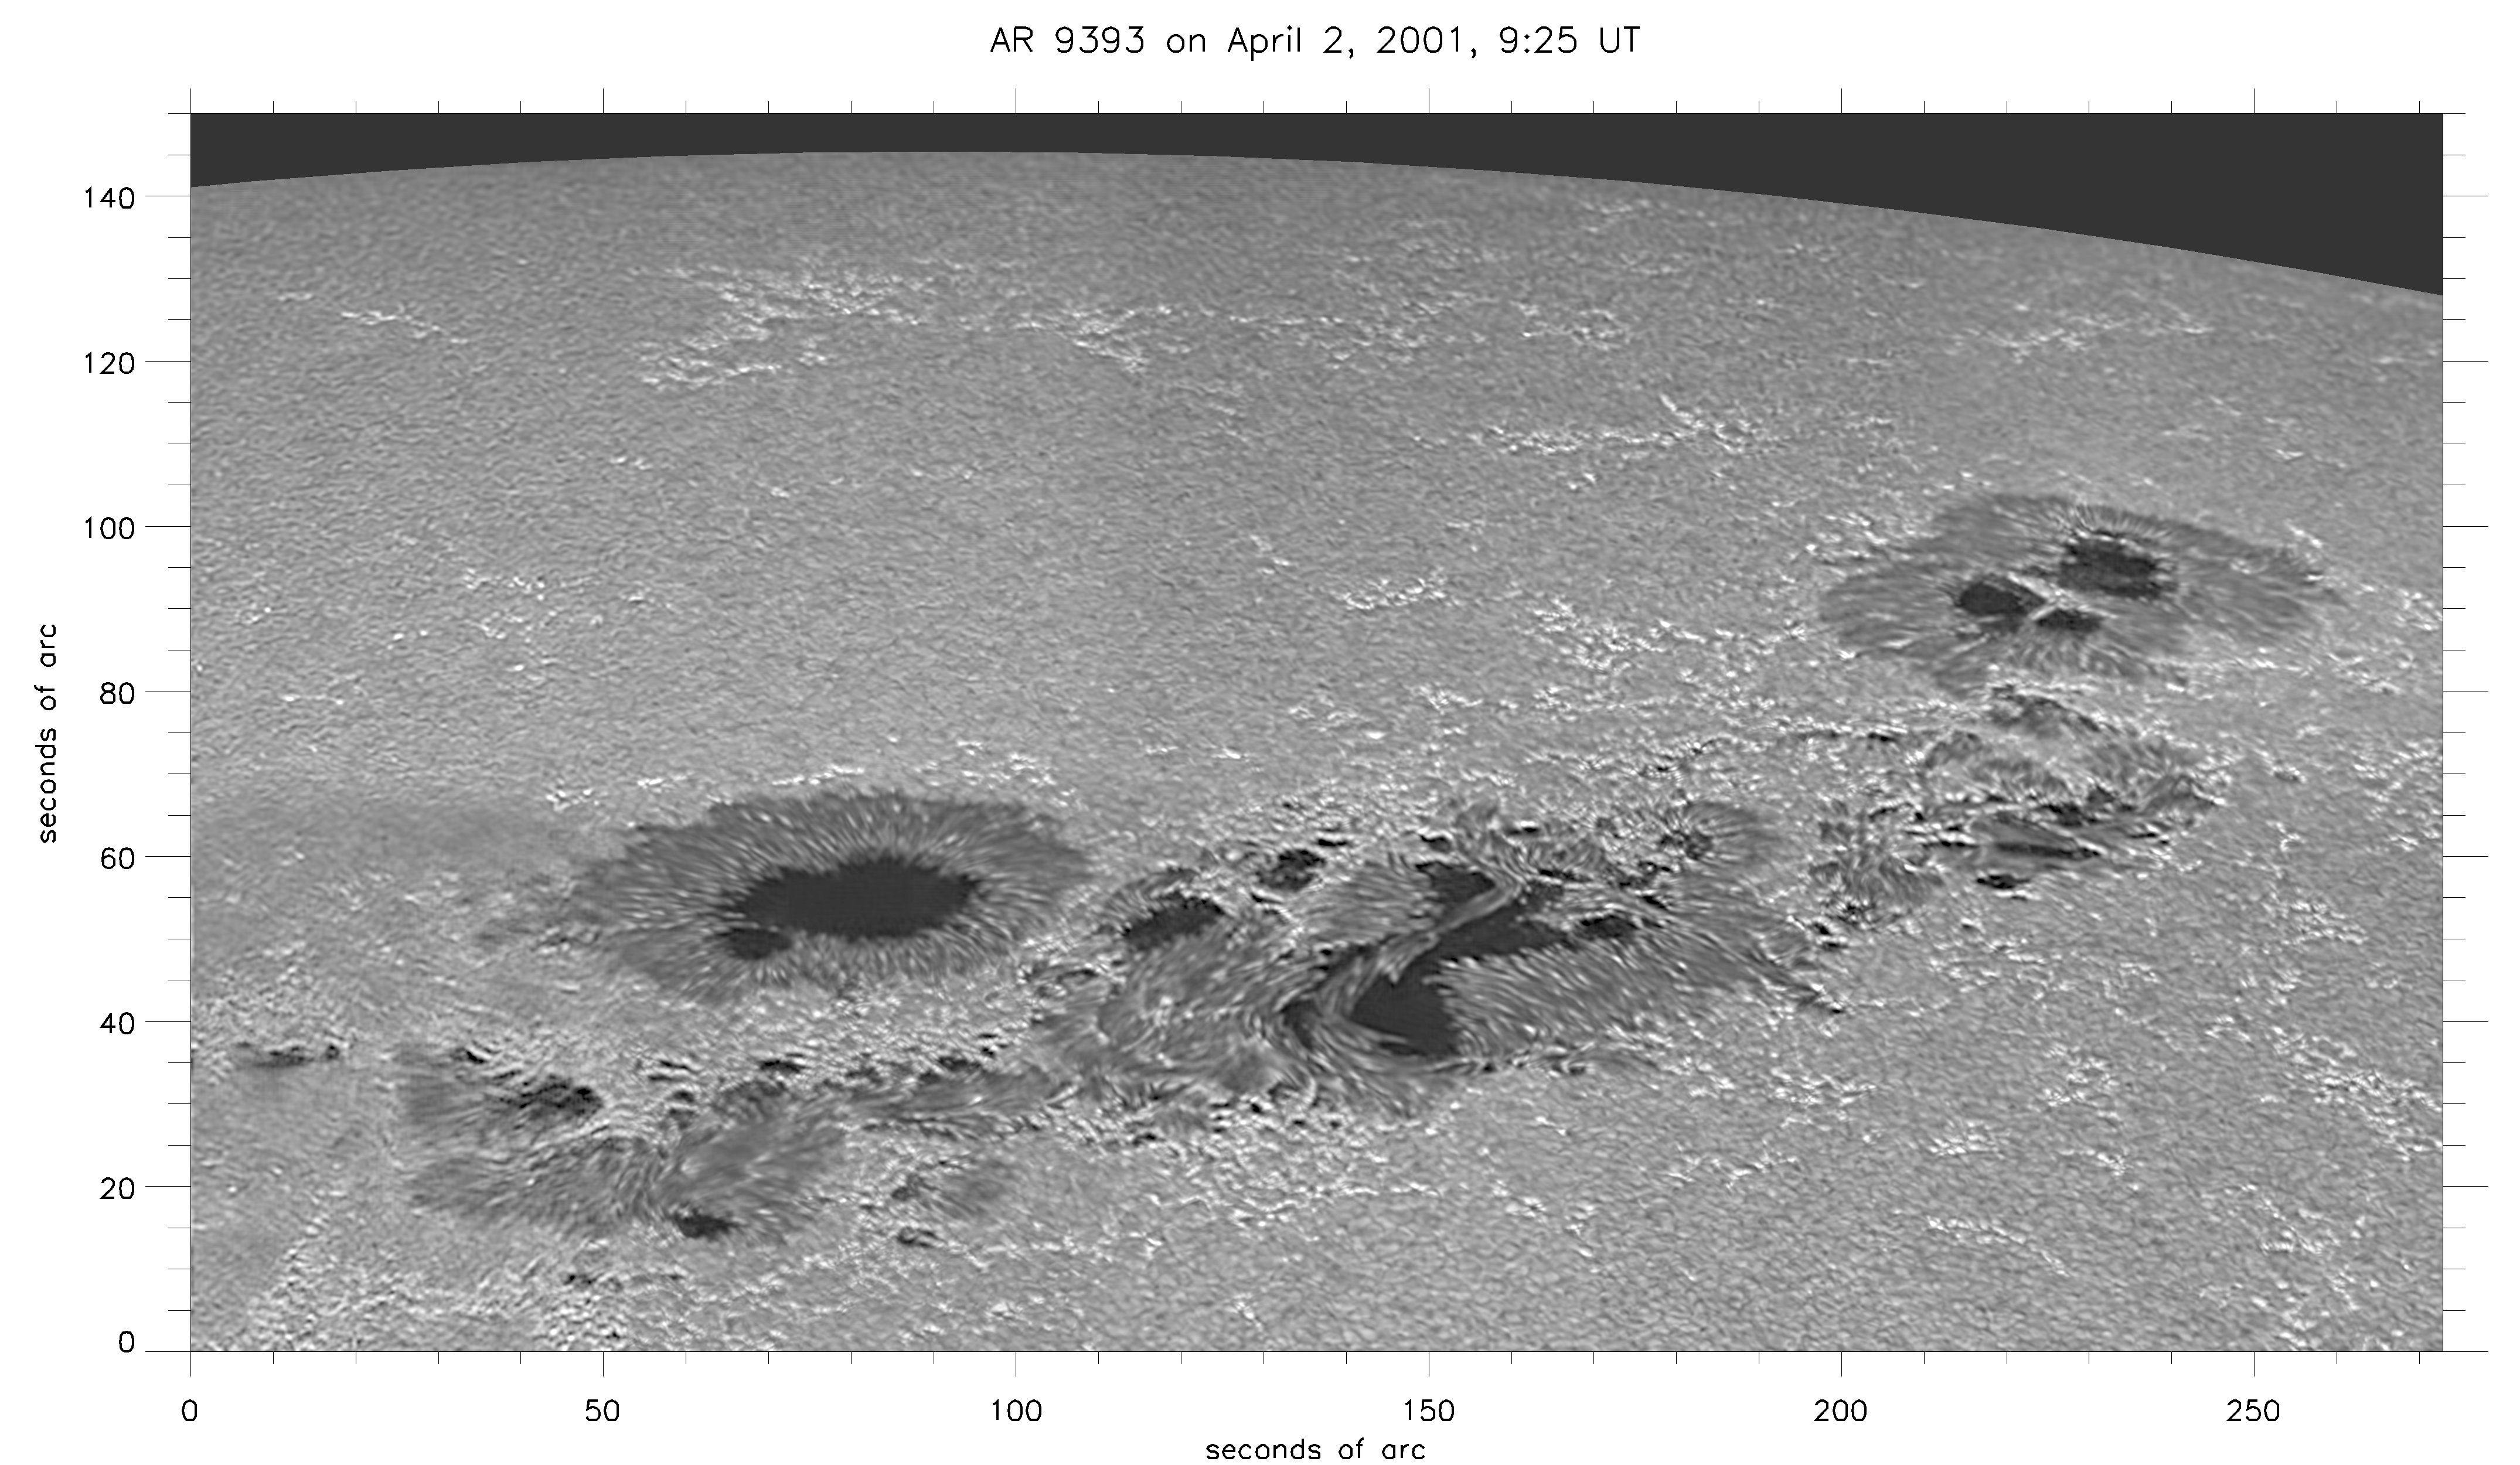
[jpg] AR9393 near the limb
First DOT poster with picture of the sun, showing giant active region AR9393 (the largest of the past activity cycle) near the West limb of the sun.
[ps] AR9393 near the limb
Same in PostScript