The AreaView Tool
AreaView is an advanced visualization tool for software
architecture information. At is simplest, AreaView provides the functionality
of a UML diagram
viewer. In this respect, AreaView is similar to Rational Rose or Together, with
the viewing, but without the editing capabilities. However, AreaView goes
beyond such tools by providing several innovative features to visualize extra
information beyond the UML diagrams themselves. Such information is currently
of two types: metrics and areas of interest. Metrics are specified per diagram
element (e.g. class), are of different types (e.g. boolean, integer, or float),
and can be visualized with a variety of graphical techniques, such as 2D or 3D
colored glyphs similar to histograms. Visualizing metrics on UML diagrams is
useful to get many insights on how the system properties encoded by the metrics
map to the system architecture. Areas of interest are specified per group of
elements and are drawn in various ways (e.g. contours or filled soft shapes)
around their contained elements. By supporting areas of interest, AreaView
provides users with exactly the same type of functionality as sketchy
annotations done with pen on paper diagrams.
Features of AreaView in a nutshell:
![]() Visualizes UML diagrams in DTD-compliant
XMI format, such as produced by Rational Rose
Visualizes UML diagrams in DTD-compliant
XMI format, such as produced by Rational Rose
![]() Several diagram types are supported:
class, message, collaboration, deployment, …
Several diagram types are supported:
class, message, collaboration, deployment, …
![]() Provides interactive navigation
functions such as zoom, pan, multiple windows, document tree view, and
correlated selections
Provides interactive navigation
functions such as zoom, pan, multiple windows, document tree view, and
correlated selections
![]() Scales to documents containing hundreds
of elements and tenths of diagrams
Scales to documents containing hundreds
of elements and tenths of diagrams
![]() Visualizes any number of metrics defined
on any subset of the present diagram elements
Visualizes any number of metrics defined
on any subset of the present diagram elements
![]() Highly customizable metric
visualizations: pie, 2D bar, 3D bar, icons, checkboxes, …
Highly customizable metric
visualizations: pie, 2D bar, 3D bar, icons, checkboxes, …
![]() Adding metrics to an existing diagram
document is very easy: Just provide a separate XML file containing the metrics’
names and values
Adding metrics to an existing diagram
document is very easy: Just provide a separate XML file containing the metrics’
names and values
![]() Visualizes areas of interest using a
novel algorithm that mimics hand-drawn sketch annotations
Visualizes areas of interest using a
novel algorithm that mimics hand-drawn sketch annotations
![]() Adding areas of interest to an existing
document is just as easy as adding metrics
Adding areas of interest to an existing
document is just as easy as adding metrics
![]() Installing AreaView is as simple as
clicking the installer executable (under Windows)
Installing AreaView is as simple as
clicking the installer executable (under Windows)
Download the latest
available version of AreaView for Windows here:
![]()
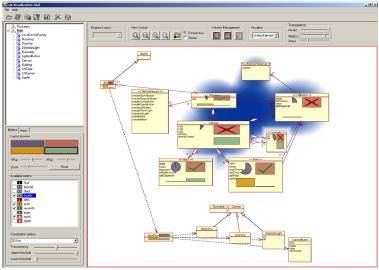
Snapshots of AreaView are presented below:
|
Overview of the AreaView tool interface |
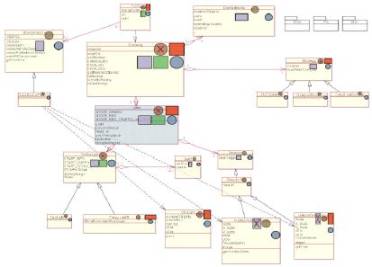
Class diagram with several 2D metric icons |
|
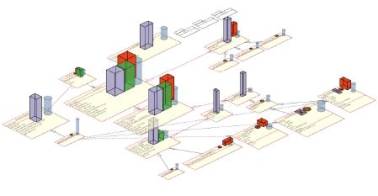
Class diagram with several 3D metric icons |
Complex diagram with several areas of interest |
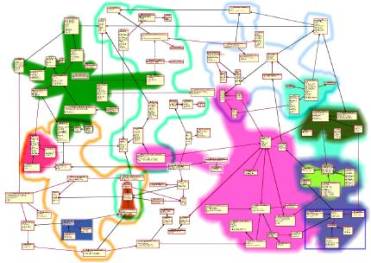
Publications describing the design and use of AreaView:
![]() Visualization
of Areas of Interest in Software Architecture Diagrams (H. Byelas, A. Telea,
Proc. ACM SoftVis’06)
Visualization
of Areas of Interest in Software Architecture Diagrams (H. Byelas, A. Telea,
Proc. ACM SoftVis’06)
![]() Visualization
of Areas of Interest in Component-Based Software Architectures (H. Byelas,
E. Bondarev, A. Telea, Proc. EUROMICRO’06)
Visualization
of Areas of Interest in Component-Based Software Architectures (H. Byelas,
E. Bondarev, A. Telea, Proc. EUROMICRO’06)
![]() Visual
Exploration of Combined Metric and Architectural Information (C. Lange, M.
Termeer, A. Telea, M. Chaudron, Proc. Vissoft’05)
Visual
Exploration of Combined Metric and Architectural Information (C. Lange, M.
Termeer, A. Telea, M. Chaudron, Proc. Vissoft’05)
AreaView was developed as part of the Space4U and Trust4All ITEA projects.