The MemoView Tool
MemoView is a handy tool for visualizing the
evolution in time log information. Examples of such data visualized by MemoView
are:
![]() Profiling
information showing the usage of dynamic memory (heap) in software applications
Profiling
information showing the usage of dynamic memory (heap) in software applications
![]() Commit information maintained by software
configuration management tools such as CVS or Subversion
Commit information maintained by software
configuration management tools such as CVS or Subversion
The aim of
MemoView is to present a compact and intuitive view of how logs containing
hundreds of thousands of events. This helps users discover interesting patterns
in their data, which should further assist them in better managing the data or
the system(s) that have generated it. Examples of use cases are:
![]() Find out how dynamic memory gets
fragmented in time
Find out how dynamic memory gets
fragmented in time
![]() Understand the memory allocation pattern
of a memory allocator for optimizing its behaviour
Understand the memory allocation pattern
of a memory allocator for optimizing its behaviour
![]() Quickly get an overview of what is in a large
CVS/Subversion software repository
Quickly get an overview of what is in a large
CVS/Subversion software repository
![]() Find out files/folders in a repository
that show a similar evolution in time for some periods
Find out files/folders in a repository
that show a similar evolution in time for some periods
![]() Find out memory allocations that show a
similar evolution in time for some periods
Find out memory allocations that show a
similar evolution in time for some periods
MemoView is a simple to install and run tool
that you can download and experiment with freely.
Download
the latest available version of MemoView for Windows here:
![]()
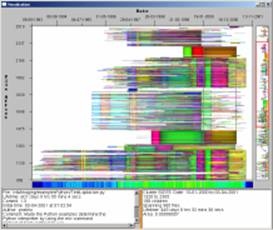
Some snapshots of MemoView are presented below:
|
Overview of the MemoView tool interface |
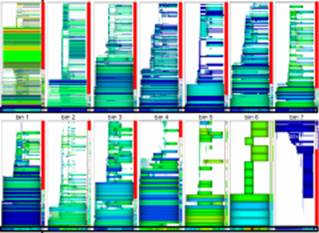
Memory allocation visualization |
|
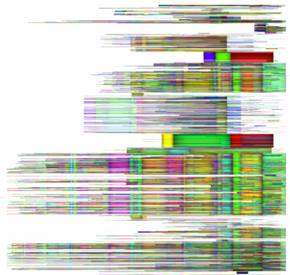
Repository visualization (1) |
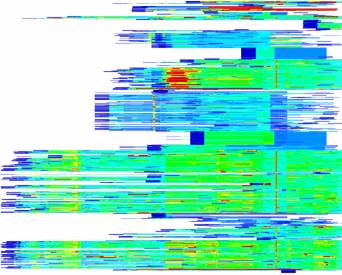
Repository visualization (2) |
Publications describing the design and use of
MemoView:
- Visualizing
Time-Dependent Software Artifacts (
- Multiscale Visualization of
Dynamic Software Logs (