ShaRP: Shape Regularized Multidimensional Projections
Problem
Multidimensional projections are well-established methods for visualizing large datasets in which every observation has tens up to hundreds of dimensions. Many such algorithms exist, such as PCA, t-SNE, UMAP, or our own Neural Network Projection.
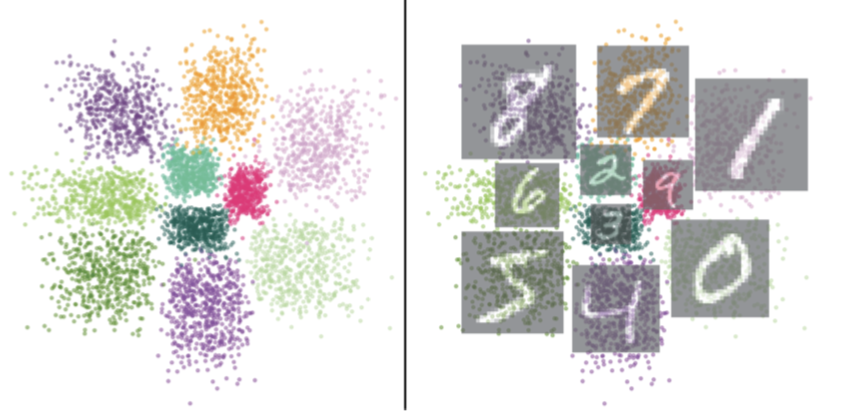
However, most projection algorithms do not control the shapes they generate. For example, take the well-known MNIST dataset. The image below shows the projection an autoencoder (AE, a) and SSNP (b) would create. Clearly, the shapes of the same-color points (data points having the same label, thus similar), are kind of arbitrary. Surely, this can confuse the user to infer a specific distribution of these points -- which is not the case.
Solution
The ShaRP method we propose solves this simply and efficiently. It essentially extends SSNP (which itself is an autoencoder with an additional label-based cost) to force same-label points to obey a distribution given by the user. In the image above, we force this distribution to be Gaussian. Thus, we get same-label points in rather ''circular' clusters.
Much more shape control is possible. The image below shows the same MNIST dataset, now forcing the same-label points to group into squares. This helps e.g. annotating point clusters by (rectangular) image thumbnails.
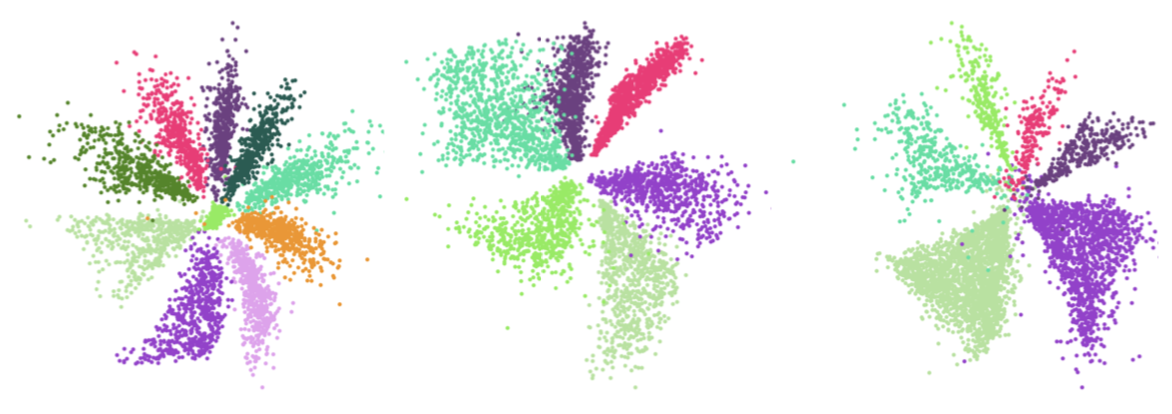
The image below shows three datasets (MNIST, HAR, Reuters, from left to right) projected by ShaRP to create triangular clusters.
Results
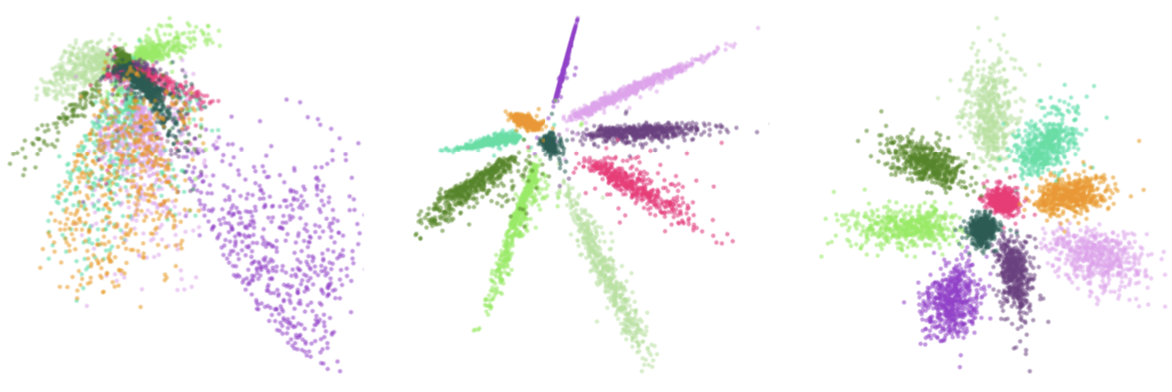
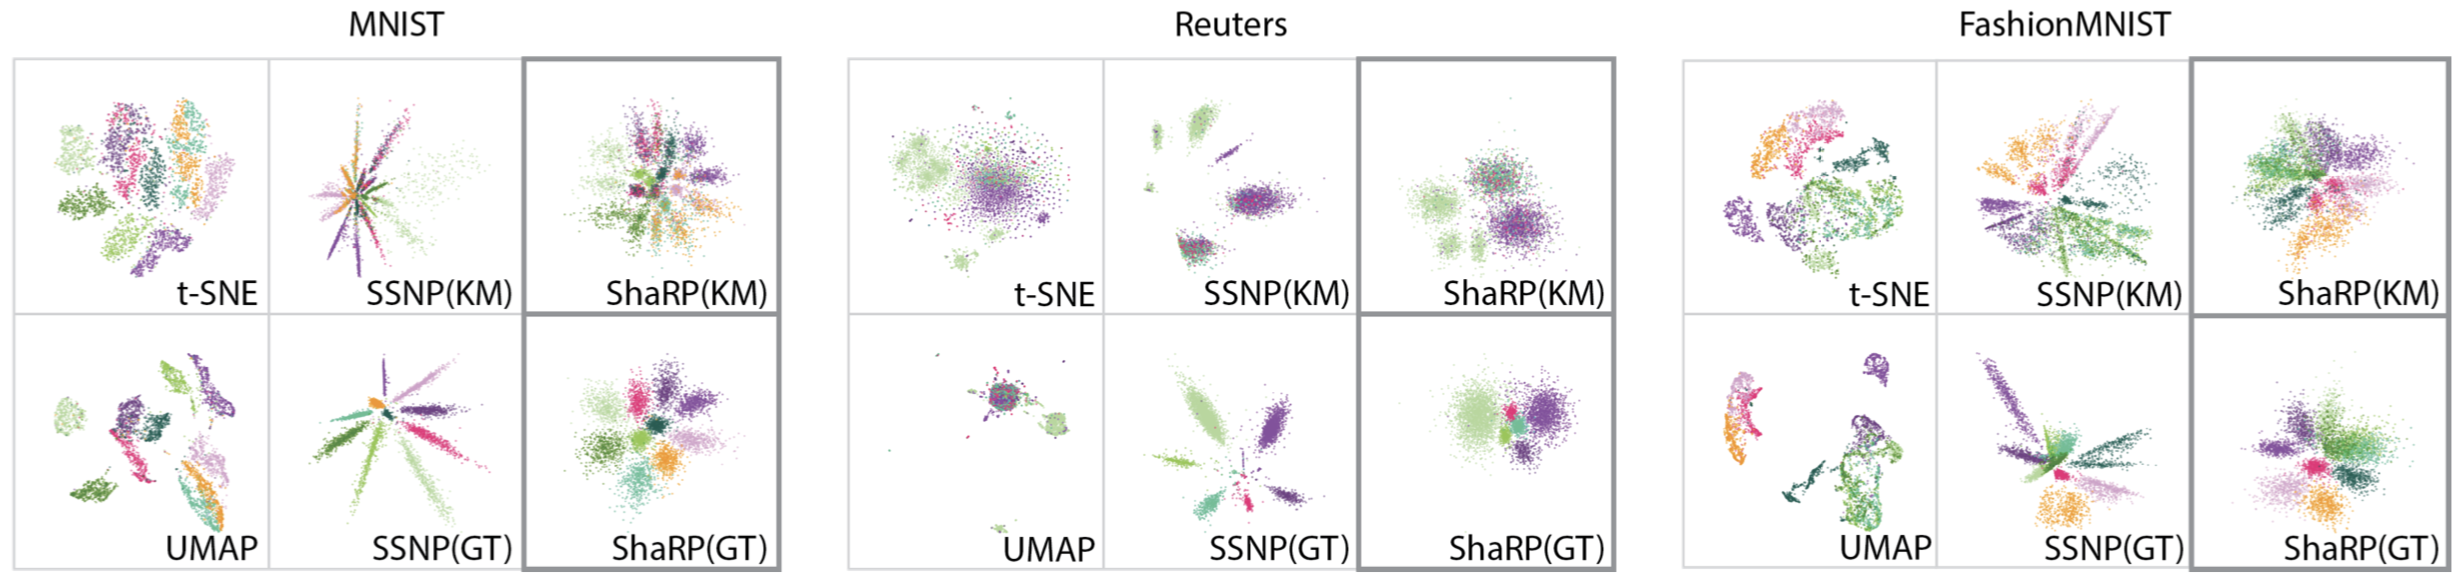
Why is this useful? Consider the image below, comparing ShaRP (favoring round clusters) with t-SNE, UMAP, and SSNP for three datasets. We see that ShaRP produces easier-to-understand, less shape-biased, images.
Implementation
ShaRP is implemented in Python. The full source code is available here.
Publications
ShaRP: Shape-Regularized Multidimensional Projections. A. Machado, M. Behrisch, A. Telea. Proc. EuroVA 2023 (Best paper award)