Peter Kuipers Munneke
Assistant professor in Glaciology
About me

I am an assistant professor in the field of glaciology and polar meteorology at the Institute for Marine and Atmospheric research Utrecht (IMAU), part of Utrecht University, The Netherlands. I'm active on Mastodon.
Featured paper: Firn review paper
We study firn because it contains clues about past climate, because it modifies meltwater runoff into the ocean, and because it can help us to measure ice-sheet mass change from space using satellites. After a lot of hard work, an overview paper on firn is out!
Blue ice in Antarctica
Using a spectral unmixing technique, we map daily fractions of blue-ice area over Antarctica for the 22-year period since 2000, using the full available MODIS archive. This FABIAN product is published in Remote Sensing of Environment.
How much does it snow on Larsen C?
The answer is: about 7,000,000,000,000,000,000 snowflakes per year. But how do we know? And why do we care?
In July 2017, a 6000 squared kilometre iceberg broke off the Larsen C ice shelf. It triggered the question: what next? Is the entire ice shelf going to collapse? Or is this calving event not important for the survival of the remaining ice? An important question, which some scientists try to answer using models.
But these models need real-world data as input, for example the annual snowfall on the ice shelf. Which is a tricky number to determine. We made a best estimate of the amount of snowfall on Larsen C using airborne and ground radar, automated snow height rangers, and a polar climate model.
Data, data, data
Actually, we are looking to determine the surface mass balance, which is the amount of snowfall minus sublimation, runoff of water into the ocean, etc. Since 2008, a number of field trips to the Larsen C have yielded a lot of data on the surface mass balance. First of all, hundreds of kilometres of radar data are available. These were collected by towing a radar behind a skidoo and record the return echoes from the emitted radar pulses. The tracks are shown in colors in the map below. Next, we have data on snow density from a number of snowpits, dug by various field parties. And finally, automated height rangers have been measuring surface rise due to snowfall since 2009.
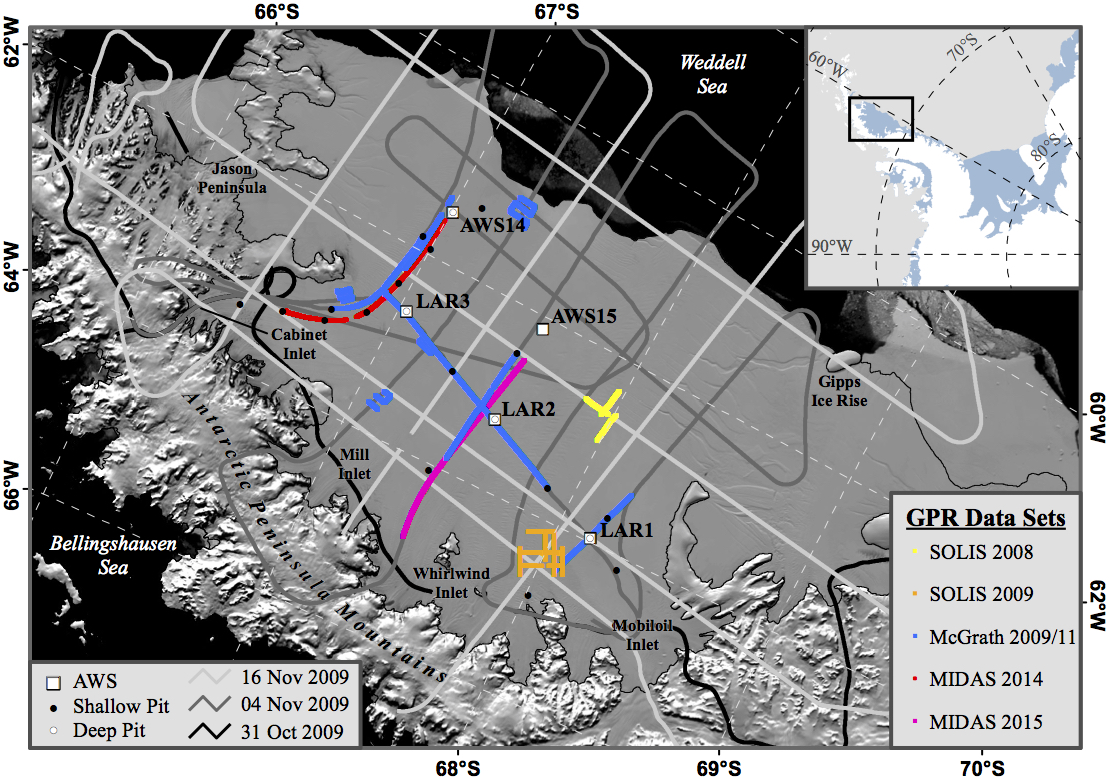
Larsen C with ground penetrating radar (colors), airborne radar (gray lines), snow height rangers (squares) and snowpits (circles).
Reflector
In the ground penetrating radar echoes, we see a very persistent strong reflection at a depth of 25-45 metres below the surface. We do not know for sure what caused this reflector, but we do think that it was formed at the same time everywhere on the ice shelf, for example by a single strong melt event or melt season. In that way, we can look at the amount of snow on top of the reflector, and interpret it as the amount of snow that has fallen since the reflector formed. This analysis shows that the surface mass balance is higher in the southern part of the Larsen C than in the north.
Total amount of snow
The polar climate model RACMO2 has an estimate of snowfall on Larsen C, but a comparison with observed snowfall rates suggests that RACMO2 is underestimating it (by about 15%). So we nudged the RACMO2-surface mass balance to the observations (see map below) and find that the regional differences are large: in the north, there is about 70-90 cm of snow each year (200-250 mm water-equivalent per year). In the southwest, this can be more than 2.5 m of snow (700 mm w.e.). Taken together, about 21 gigatonnes (Gt) of snow are added to the ice shelf each year. That is roughly 7 x 10¹⁸ snowflakes.
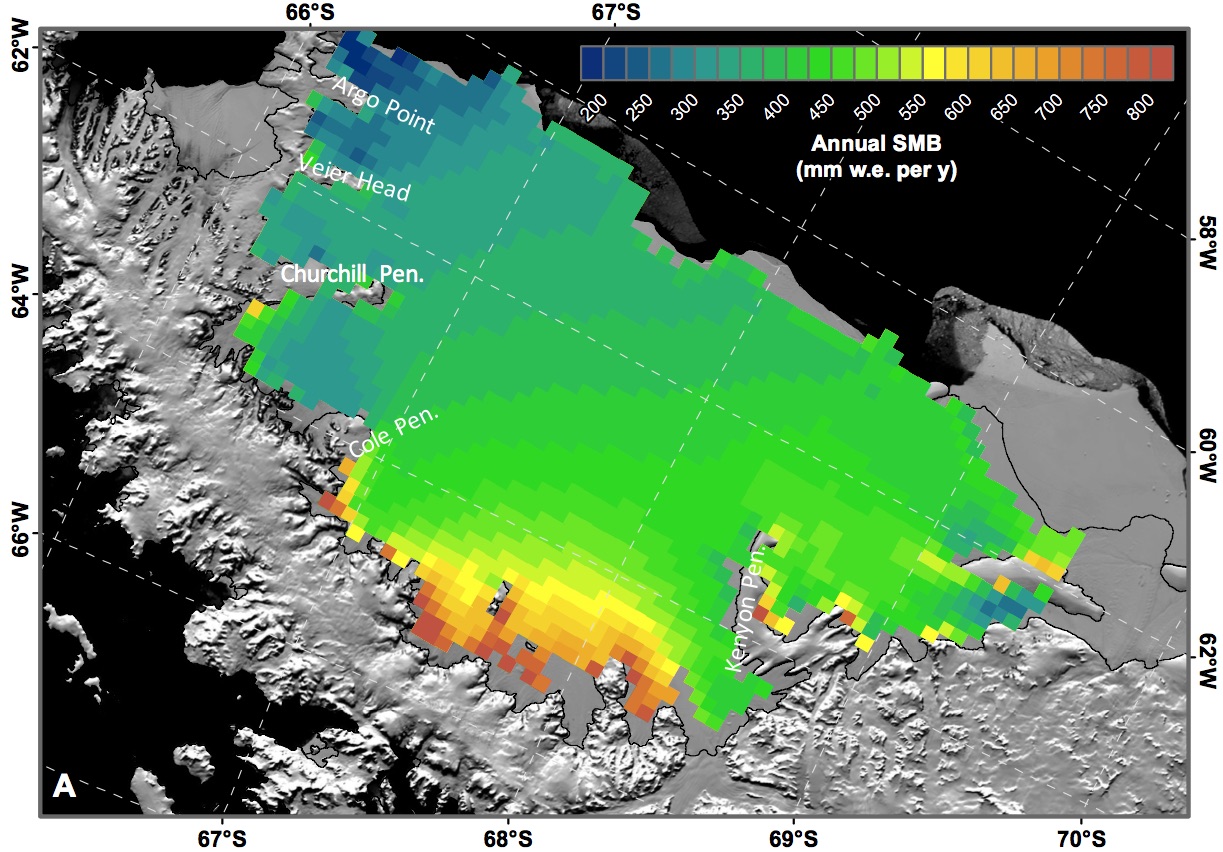
Best estimate for contemporary Larsen C SMB (in mm w.e. per year).
Data download
The calibrated SMB dataset for Larsen C is available for download.
This research appeared in The Cryosphere on 1 November 2017: Kuipers Munneke, P., D. McGrath, B. Medley, A. Luckman, S. Bevan, B. Kulessa, D. Jansen, A. Booth, P. Smeets, B. Hubbard, D. Ashmore, M. R. van den Broeke, H.
Sevestre, K. Steffen, A. Shepherd and N. Gourmelen. 2017. Observationally constrained surface mass balance of Larsen C Ice Shelf, Antarctica. The Cryosphere, 11, doi:10.5194/tc-11-2411-2017.  . This research was financed by the Netherlands Polar Programme and NESSC. Field trips were undertaken as part of several NSF, NERC, and NWO grants.