
Practical Data Visualization
Overview
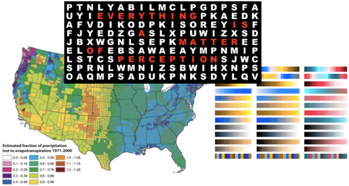
Many scientists are increasingly confronted with the problem of expressing results of their work in terms that are easily, and compactly, understandable for large audiences. Visualization is a perfect medium for this task. Data visualization imagery is increasingly important for scientific presentations, reports, and scientific papers. However, generating high-quality visualizations that effectively communicate desired insights, is a challenging task.
Course aims
The aim of this course is to provide an in-depth introduction to practical data visualization for scientists. The course covers a presentation of existing visualization sub-disciplines; a discussion of several visualization techniques which are frequently used in science; a discussion of relevant perception issues which should be considered when producing visualizations; and a tutorial on visualization design. Several concrete use-cases involving designing effective visualizations for a selected set of problems is used to exemplify the presented material.
Course audience
The targeted audience includes (young) researchers working in a data-intensive context, e.g. life sciences, mathematics, physics, astronomy, biology, or computer science. Students are not expected to (be able to) develop visualization software. Having a basic mathematical background including statistics, data sampling, and/or data representation, is highly helpful.
Slides (lecture)
Slides (practice)
One of the best-known tools for creating interactive information visualizations is Tableau. Tableau offers a programming-free way to visually design many types of interactive charts (bar, line, pie, area, bubble, treemaps, scatterplots, maps, and more). It imports data from Excel and CSV files. Created visualizations can be shared and interactively explored on the web with a few clicks. While not mandatory for this lecture, Tableau is an excellent place to start learning about practical information visualization. Tableau Public is freely available here.
Below we provide a short crash course into using Tableau:
Assignment
The course is finalized by a practical assignment. Details about the aims of the assignment, way of working towards completing it, and assignment execution steps are given below.
Aims
The aims of this assignment are to
- apply the taught principles, techniques, and design guidelines to the construction of a concrete data visualization
- relate the taught principles to the specific research domain(s) of the students
- practically discover the added-value, but also pitfalls and challenges, of applying data visualization techniques to concrete problems
- defend the design choices made during the construction of an own visualization, so one can better understand the design process
Way of working
- The assignment can be done either individually or in groups of two persons. In the latter case, it is expected that the delivered final report will be twice as detailed/elaborated than in the former case.
Steps
Executing the assignment has the following workflow:
1. Problem choice (right after the last lecture): Students choose a problem to work on, from their own research field. A good problem should
- be related to a data mining, data presentation, data analysis, or data discovery task
- clearly specify which are the questions to be answered on the data
- have a reasonable mapping to a visualization scenario
- be sufficiently complex to vouch the use of visualization
- be sufficiently simple to be handled up to the assignment deadline (2 weeks)
- have the required data for analysis at hand
If the students cannot find such a problem (and the corresponding data) related to their own research, a general infovis problem and data are provided below:
2. Visualization design (2 weeks): During this period, the students design and implement a visualization to address their problem, and document the obtained findings and design process. The steps of this workflow are:
- Problem description: Describe the chosen problem in terms of questions to be answered on the data
- Data description: Describe how you model your problem and data in terms of datasets
- Design: Propose one or several designs for visualizations addressing the problem/data
- Implementation: Construct the proposed visual designs using any desired/available visualization tool
- Findings: Describe both the data-related findings obtained with the visualizations and the discovered advantages and limitations of these visualizations
During this period, students are encouraged to submit intermediate reports and/or questions to the lecturers to receive feedback and help.
3. Report (end of 2 weeks period): At end, students submit a detailed report that describes the five workflow steps mentioned above. The report is evaluated by the lecturers, and feedback is sent to the students.
More details on how to structure the five steps of the report, including points of attention for each step, are provided here.