Research
My research focuses on the following main areas. Note: For an up-to-date overview, see publications.
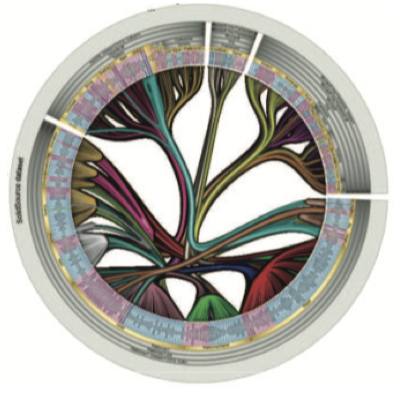
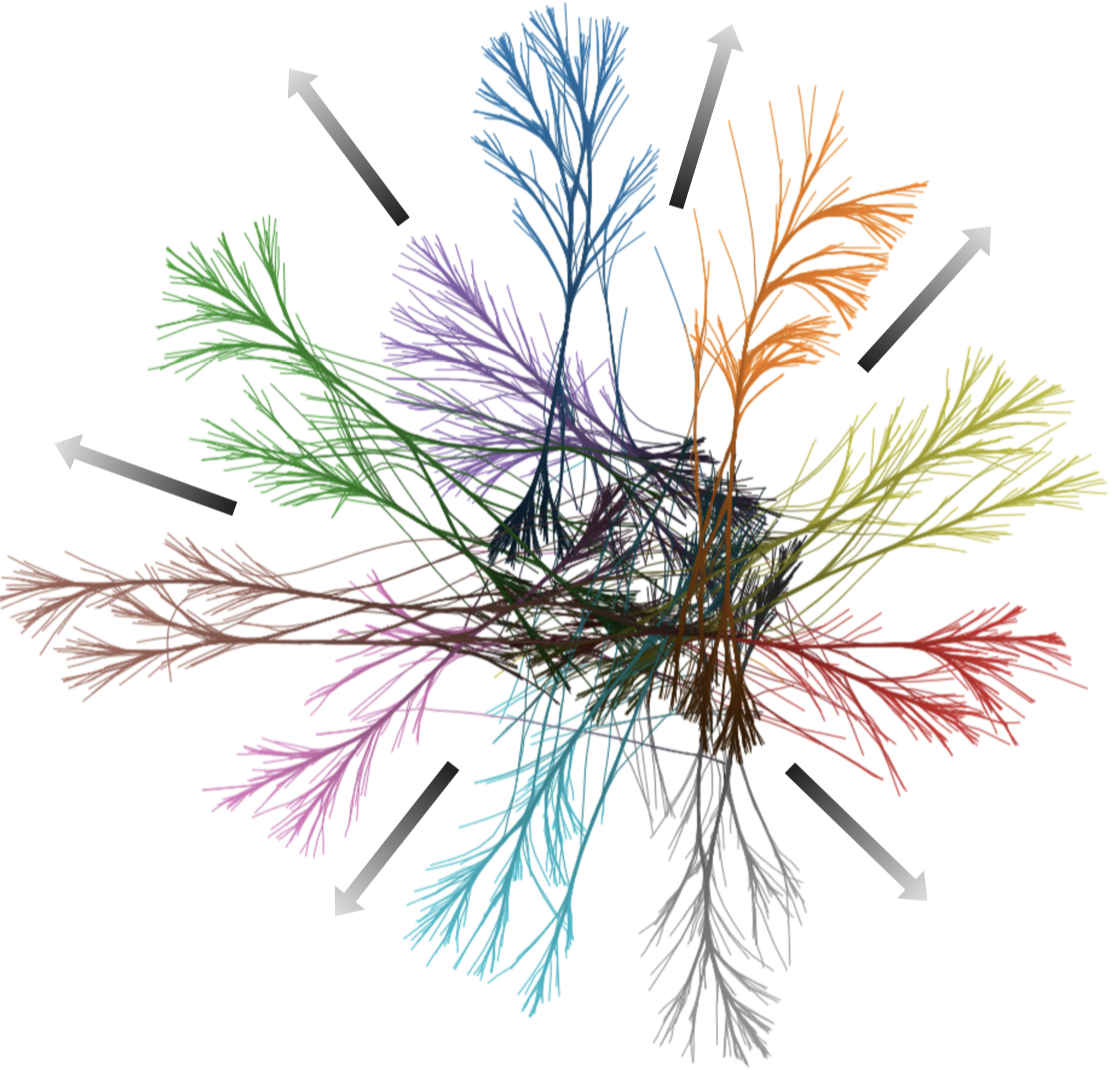
| Information Visualization Information visualization proposes suitable metaphors and interaction techniques to visually depict and explore non-spatial data. My research focuses on large multivariate graph and trail-set visualization via bundling; image-based techniques; and depicting high-dimensional data via dimensionality reduction. I approach these challenges by new scalable techniques and tools using GPU programming. At a higher level, I am working on theory and techniques to unify scientific visualization and information visualization via imaging and computer graphics. | |
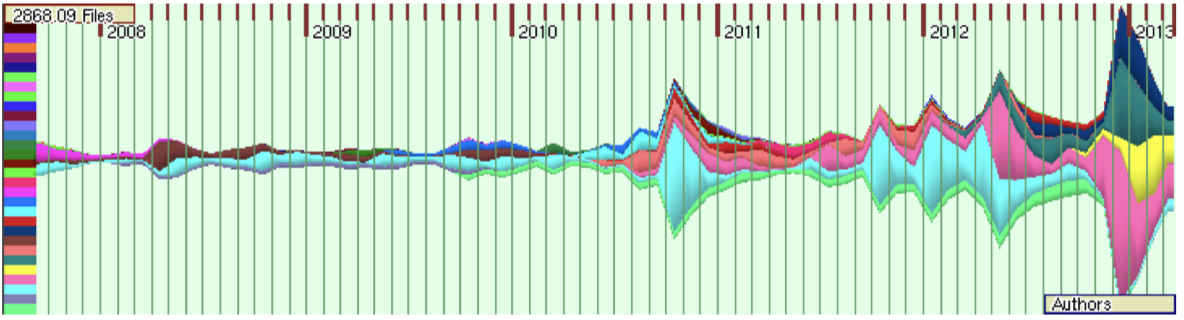
| Software Visualization and Data Mining Software visualization methods help understanding and maintaining large and complex code bases by presenting the structure, attributes, and evolution of source code in scalable and intuitive ways. I develop methods that extract various kinds of information from source code, program traces, and software repositories: dependencies, structure, quality metrics, and developer activity. I next develop tools to show, navigate, and query all this information. I implement these methods in tools that are used on real-world software systems. | |
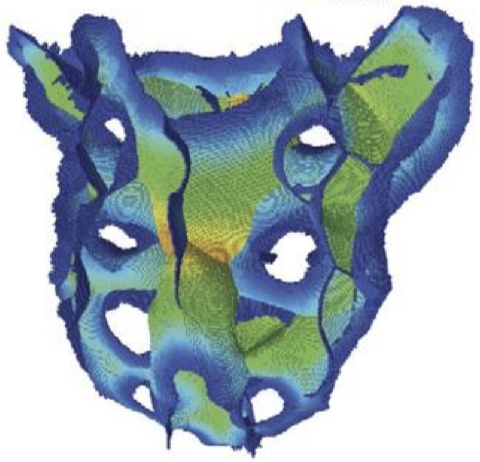
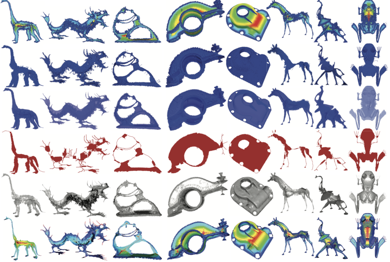
| Multiscale Shape and Field Processing Multiscale processing involves 2D and 3D shape segmentation, denoising, edge and feature detection, simplification, and matching done on several levels of detail, as well as processing several 2D or 3D fields such as scalar, vector, or tensor. These operations can be effectively and efficiently supported by several classes of methods: skeletonization (or medial axis computation), level sets, and partial differential equations. Applications include image and volume inpainting, surface reconstruction from point clouds, image and volume compression, shape segmentation shape denoising and simplification, and flow simulation. | |
| Visual Analytics Visual analytics aims to generate and test hypotheses to understand complex phenomena based on large data sets. Visual analytics is tightly connected with data science, data mining, and machine learning. I support machine learning by explaining the working of complex engines such as classifiers and providing interactive tools to incorporate the user into their design and optimization. I help machine learning engineers with tools for the design and fine-tuning such engines, and help end-users of these tools to understand how and why machine learning took its decisions. | |
| Surveys and Benchmarks State-of-the-art reports present major developments over one or more decades in a research subfield. Benchmarks compare methods, techniques, and tools to help practitioners to choose optimal ones for a given context. Both instruments are vital to help researchers and practitioners with hard, replicable, facts and recipes in the ever-expanding jungle of methods, papers, and tools. I have worked on several surveys and benchmarks on the above-described areas of my research. |