Data Visualization
Course content
This course teaches Data Visualization methods with a focus on relational and high-dimensional data. Such data appear in many of real-life applications from science, social phenomena, and engineering. The course is divided into two parts: parts - relational and high-dimensional data - as follows.
Relational data We present a model used for representation and storing relational data, called graph or network, and list applications of network visualization. We define so-called quality metrics to construct and assess network visualizations. We study several network visualization methods, including:
- Tree visualization;
- Visualizing general graphs;
- Visualizing hierarchical graphs;
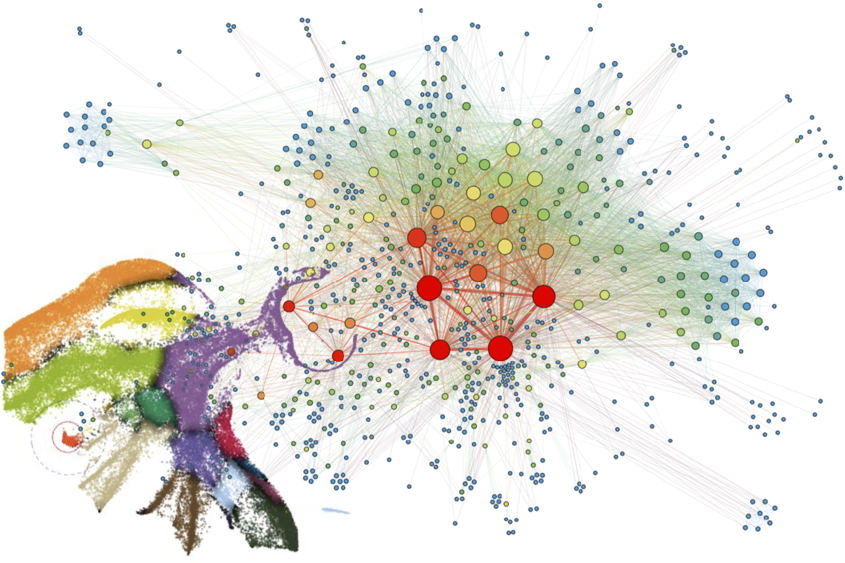
- Visualization of multilevel networks for modeling highly complex applications;
- Graph bundling.
High-dimensional data We present methods that teach the visualization of large data tables (thousands of rows, hundreds of columns) from data science, artificial intelligence, and related fields. We discuss these methods as well as quality metrics to assess them including:
- Parallel coordinate plots
- Scatterplot matrices
- Table lenses
- Dimensionality reduction
Learning objectives
After completing the course, the students will:
- Have an overview of the state-of-the art visualization methods for relational and high-dimensional data (Know);
- Be able to explain how these methods construct visualizations (Understand)
- Select an appropriate data visualization method and parametrize it when presented with high-dimensional or relational data (Apply)
- Assess the results of the constructed visualizations (Evaluate)
- Present and motivate all taken choices (Defend)
Course Structure
Learning objectives are achieved through weekly lectures, group project work, and intermediate update meetings. The students are provided with datasets to
- visualize these with the taught methods
- implement presented methods and explain their design decisions
- Evaluate their visualizations with presented techniques
Prerequisites
To successfully complete this course, students should
- be fully fluent in coding in a mainstream programming language (C, C++, Python, Java, C#)
- be fully able to manage data/software on their own (platforms, tools, scripting, etc)
- have a strong background in math (linear algebra, calculus, optimization, statistics)
- have basic knowledge of algorithms and computational complexity
- have a background in visualization and/or graphics