Assignment B: Dependency evolution analysis
In this assignment, you will have to design and develop a tool that is able to analyze the evolution of source-code dependencies from a given software repository. The idea of such a tool is simple: Given a repository containing source code, the user of the tool would like to:
- extract the dependencies between software entities within each version of the software
- have some means of visualizing the evolution of the dependencies from version to version
Your exact set-up of this assignment strongly depends on the type of dependencies you choose to explore. In turn, this strongly depends on the tools which you will use to extract dependencies. In this assignment, you will not develop such as dependency extraction tool from scratch, as this is a highly complex task. Moreover, you will only focus on extracting dependencies from a single programming language: C, C++, C# or Java.
NOTE: Given the complexity of this assignment, it is recommended that you do it
- in groups of two
- only if you are both good programmers
The steps of the assignment are described below.
Step 1: Acquiring the data
Aim:
In this step, you will develop infrastructure to collect the software data from which you next extract the dependencies. For this, you can consider software stored in SVN, Git, or TFS repositories.
To access a repository and get information on the number of stored revisions, the files modified in each revision, and getting the actual files, you can use existing third-party tools:
- SVN: A good starting point is the SharpSVN library. Its use is documented in an earlier project, very similar to your assignment, is described here.
- TFS: A good starting point is the TFS API. Its use is documented in an earlier report here.
For the start, you can just manually download a single revision from your repository of choice, and proceed to step 2.
Step 2: Extracting the dependencies
Aim:
The aim of this step is to set up a dependency extractor This is a tool which is able to generate software dependencies from an already downloaded revision (set of files) of a software repository. You have already acquired one version of such a repository in step 1. Now it is time to extract the dependencies. For this, you can use several code analysis tools:
- CCCC: The CCCC (C and C++ Code Counter) tool is a simple, easy-to-use, analyzer that scans source files written in a number of programming languages (C and C++, among others) and extracts a number of metrics and dependencies. In this assignment, we are not interested in the extracted metrics, but the dependencies. For each code module (which is a class in the case of C++), CCCC extracts its clients and suppliers. The clients are other classes which use the given class. The suppliers are other classes that the given class uses. As use relationships, CCCC recognizes a number of software dependencies, such as inheritance, has relations (class X has a class Y data-member or pointer-to-class Y* data-member), and pass relations (class X passes a given class Y by value or by reference in one of its methods).
CCCC is easy to run on a set of files: Just give the files as arguments on the command line, optionally using wildcards. As output, CCCC generates both XML and HTML, which is reasonably easy to parse in order to extract dependencies. This will be your job: Run CCCC on the local copy of the software repository and parse its output to extract the dependency relations generated.
More information on CCCC is available here. - Recoder: Recoder is a Java library that performs full syntactic and semantic analysis of Java source code. The library scans source code provided by the user. Next, it offers APIs to examine the results, e.g. iterate over all classes, find all methods of a given class, and find all callers and callees of such a method. Recoder is very robust, very fast, well-maintained, and reasonably easy to learn and use. It is arguably one of the best open-source libraries for performing language analysis for Java.
Recoder is publicly available here. - NRefactory: What Recoder is for Java, is NRefactory for C#. NRefactory is an open-source framework providing APIs for full syntactic and semantic analysis (and also refactoring) of C# code. It shares the same features of Recoder: open-source availability, good documentation, good maintenance, speed, and robustness.
NRefactory is publicly available here. - Rigi: The Rigi toolset is a powerful framework containing several tools for analyzing and visualizing source code bases. Here, we focus a subset of Rigi’s functionality, namely its capability to extract dependencies from C source code. For this, Rigi has a simple but effective C language parser, cparse. cparse is able to extract a dependency graph from C source code. The nodes of this graph are function definitions, function prototypes, variables, constants, and data types. The arcs of the graph indicate dependencies, such as: calls, declares, accesses, references, returns. The exact definition of these dependency relations is listed in the Rigi cparse manual.
cparse can be run from the command-line on preprocessed C source code. To perform the preprocessing, you can use rigiparse, a second utility coming with the Rigi toolset. The extracted dependencies are stored in a simple-to-read text file, with the extension .rsf. RSF files contain a simple entity-relationship of the extracted dependency graph – they are documented in detail in the Rigi online manuals.
Rigi is publicly available for download here.
Step 3: Dependency visual analysis
Aim:
You now have the dependencies already extracted from step 2. The question is now: how to present these to the user in an insightful, useful way? For this, you can use a graph visualization. Indeed, since the dependencies for a graph, the best way to communicate this to an analyst is to draw that graph.
To construct a graph visualization, you can use the GraphViz. GraphViz is a powerful toolkit that enables users to
- lay out a graph, i.e. construct a geometric representation of the graph
- draw the graph, i.e. construct an actual picture of the above geometry (also called a layout)
GraphViz can be used either as a set of standalone programs, connected via files and command-line options, or as a library via a C API.
When constructing this visualization, you should consider several points (and answer the questions below in your report):
- what data to visualize? Simply dumping the entire graph on the screen will probably not work, since it is (a) too large to compute an intelligible layout and (b) it contains too many types of relations and nodes. Better strategies are (a combination of) the following:
- select the elements of interest in the graph, e.g. by letting users specify a starting point (function, class) and visualizing only those elements reachable from the given starting element;
- partition the dependency graph into separate subgraphs, based e.g. on the type of relations encountered (call, pass by value, pass by reference, etc). This delivers a set of related, smaller, graphs rather than a giant entangled graph. You then can visualize all these graphs separately.
All in all, do not try to directly visualize a graph larger than a few hundreds of nodes and/or edges, since this will almost surely lead to a cluttered image.
- how you want to draw the data? Three main decisions are to be taken here:
- how to lay out the graph
- how to draw nodes and edges in the resulting layout
- how to show changes of dependencies over time
GraphViz offers three main types of layout:
- hierarchical directed (the dot tool)
- radial (the twopi tool)
- force-directed (the neato tool).
Each layout produces a different type of drawing, and also is best for another type of graph. dot and twopi are quite good for directed graphs with few cycles. dot produces sometimes more understandable pictures, given the strict ordering of nodes in layers. However, twopi produces more compact pictures. neato is better for general, strongly-connected, graphs with cycles, but can take a long time to run and produces cluttered results on large graphs.
After choosing the layout, the second question is how to draw the nodes and edges. For nodes, the main choices are shape, size, and color. For edges, the main choices are color and possibly thickness. Use these graphical attributes to show data attributes of your dependency graph. For example, you can use color and shape to show the types of entities and/or relations. You could use size to emphasize the more important entities in your system, e.g. those having the largest number of connected incoming and/or outgoing edges. Also, you can use color, size, and shape to show how dependencies change in time.
As a general advice, do not overdo the graphics with too many annotations. Graphs can easily become too cluttered, especially if densely connected, so the best thing to do here is to stay minimal.
The figures below give you an idea of the type of result to expect. These are dependency graphs extracted and visualized from real-world software systems using pretty much the same kind of tools as the ones you shall use.
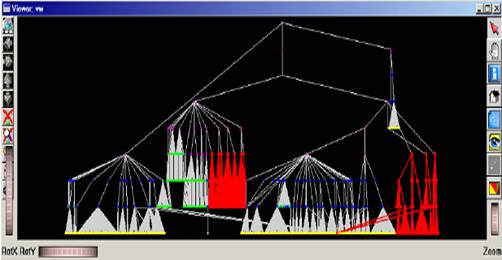
(dot layout of software containment hierarchy)

(neato layout of a call graph)
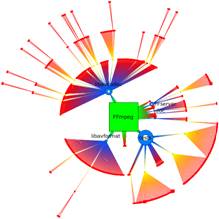
(twopi radial layout of software containment hierarchy)
Besides GraphViz, you can also visualize dependency graphs using SolidSX. In contrast to GraphViz, SolidSX is a fully integrated interactive graph-exploration tool that offers much higher scalability and user interaction to navigate large graphs and produces views having little clutter. However, SolidSX does not offer the low-level customization possibilities that GraphViz does. SolidSX is only available for the .NET platform. In contrast, GraphViz is portable to all major operating systems.
Step 4: Putting it all together
Aim:
The aim of this step is to assemble all software components you have used and/or designed in the previous three steps (software source code acquisition, extraction of dependencies, visualization) in a coherent, easy-to-use tool. The aim of this step is not to produce a highly polished, end-user tool, however. It is to produce a demonstrator that the person assessing your work can easily run offline, i.e. not in your presence, in order to reproduce the results.
For this step, you can use different methods. Think of mainly of scripting of several operations, implemented as standalone executables, into a ‘scenario’ application. Alternatively, you can bundle all the developed components into a single tool controlled by a GUI. However, the actual solution is left at your choice.
Deliverables
To complete this assignment, you have to deliver
- a binary distribution of your tool, ready to run on a platform of your choice (Windows, Linux, or Mac OS X). The binary should be accompanied by a short README describing installation and how to start and use the tool.
- the source code of your tool. This should be accompanied by a makefile (or similar build script, e.g. Visual Studio project), all the third-party libraries your project uses, and instructions on how to build the binary.
- a report describing the development, usage, and results obtained using your tool.
Example
An earlier (good) example of this assignment being completed by former students, including both binaries and source code, is available here. Feel free to study it and borrow ideas, third-party libraries, and designs.