Visual exploration of software structure and dependencies
Software systems consist of multiple, complex networks of entities and relations. Entities can be packages, files, classes, namespaces, and functions. Relations can encode structure, such as physical containment or scoping, and dependencies, such as calls, uses, and data access. Both entities and relations can have multiple attributes, such as name, source code, and quality metrics.
Visualizing structure and dependency data is a challenging tasks. Even moderate-size systems contain thousands of entities and relations. Large systems such as Mozilla Firefox, KDE Office, or the Linux kernel contain hundreds of thousands of entities and relations. We research new methods to extract data from source code bases and present it in ways that facilitate exploration and analyses, such as detecting modularity problems, planning refactoring, and reverse-engineering architecture from code. Ease of use and integration of the entire method-set is of capital importance.
Hierarchical edge bundles with metrics
Hierarchical edge bundles (HEBs) are a powerful method to visualize large structure and dependency graphs. We extended the original technique with the ability to add an open set of software metrics to the visualization of both entities and relations, as well as easy-to-use interactive navigation. The resulting visualization was integrated with several data extraction options that makes it easy to extract entities, relations, and metrics from real-world code sources in C, C++, .NET, and Java.
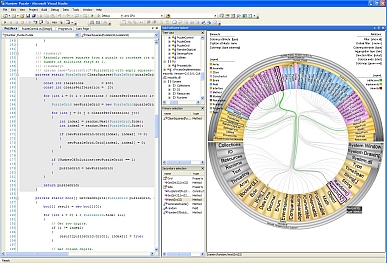
Play the video below (YouTube) to see this technique in action.
We use the same technique also to visualize code duplication.
An independently maintained, industry-strength, implementation of our method, which adds integration with Microsoft's Visual Studio, is available here.
Installation: Follow the wizard instructions. Select the license file provided in this ZIP file. Note: The above license is provided strictly for personal educational use and CANNOT be used in any commercial activity.
Multiscale image-based edge bundles
(2nd best paper award at EuroVis 2010)
HEBs are great for visualizing large and complex sets of dependencies. However, if the dependency set is very large, they sometimes generate images which are hard to understand. Often users are interested in obtaining a simplified view on such data, like in the case of understanding the top-level architecture of a large software system.
We extended the HEB method to produce such simplified images. First, we cluster dependencies based on their similarity in both the data space and the visual (layout) space. Next, we use an image-based method to render groups of related dependencies in a simplified way.
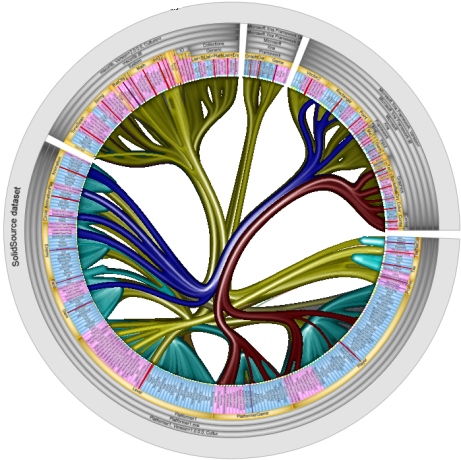
The image below shows the call relations of a C# software system, colored by type. Although we can see some structure, it is hard to tell which components are connected by a given edge bundle.
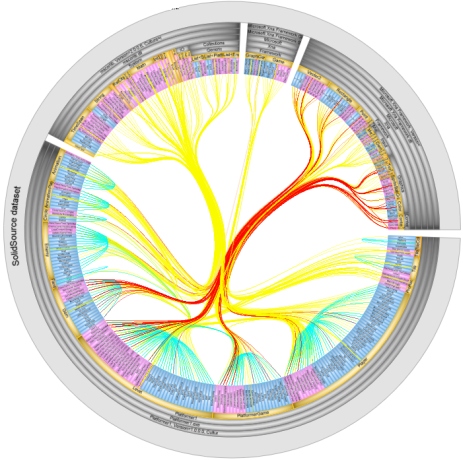
The image below shows the same dataset as above, now using the simplified bundle visualization. Edges in the same cluster relate the same components, or components having a close ancestor in the hierarchy, and are of the same type (call or inheritance). Each cluster has a different color, for illustration purposes. We now see that the central bundle (a mix of red and yellow edges in the first image) gets split into two separate bundles, which connect different groups of components.
Implementation
Multiscale bundles are constructed as follows (see image below).
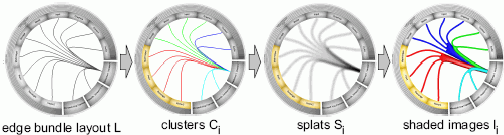
First, we use a bundling layout (e.g. HEB) to lay out edges. Resulting edges are clustered using a bottom-up agglomerative method based on edge distance. Each cluster is next splatted with a texture encoding a Gaussian kernel. The result is thresholded into binary shapes. Each shape is shaded using a cushion profile constructed using 2D robust skeletons. For details, see the papers at the end.
Interaction
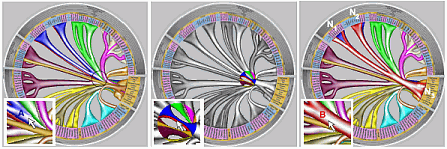
Complex graphs will inevitably create bundle overlaps. We help exploring this with a new tool: the digging lens. The lens smoothly shrinks bundles close to its center and automatically brings the bundle under the mouse to the top. The image below shows how one explores a crowded region, identifies a red bundle at the bottom, and brings it to top, all with just two clicks.
Software
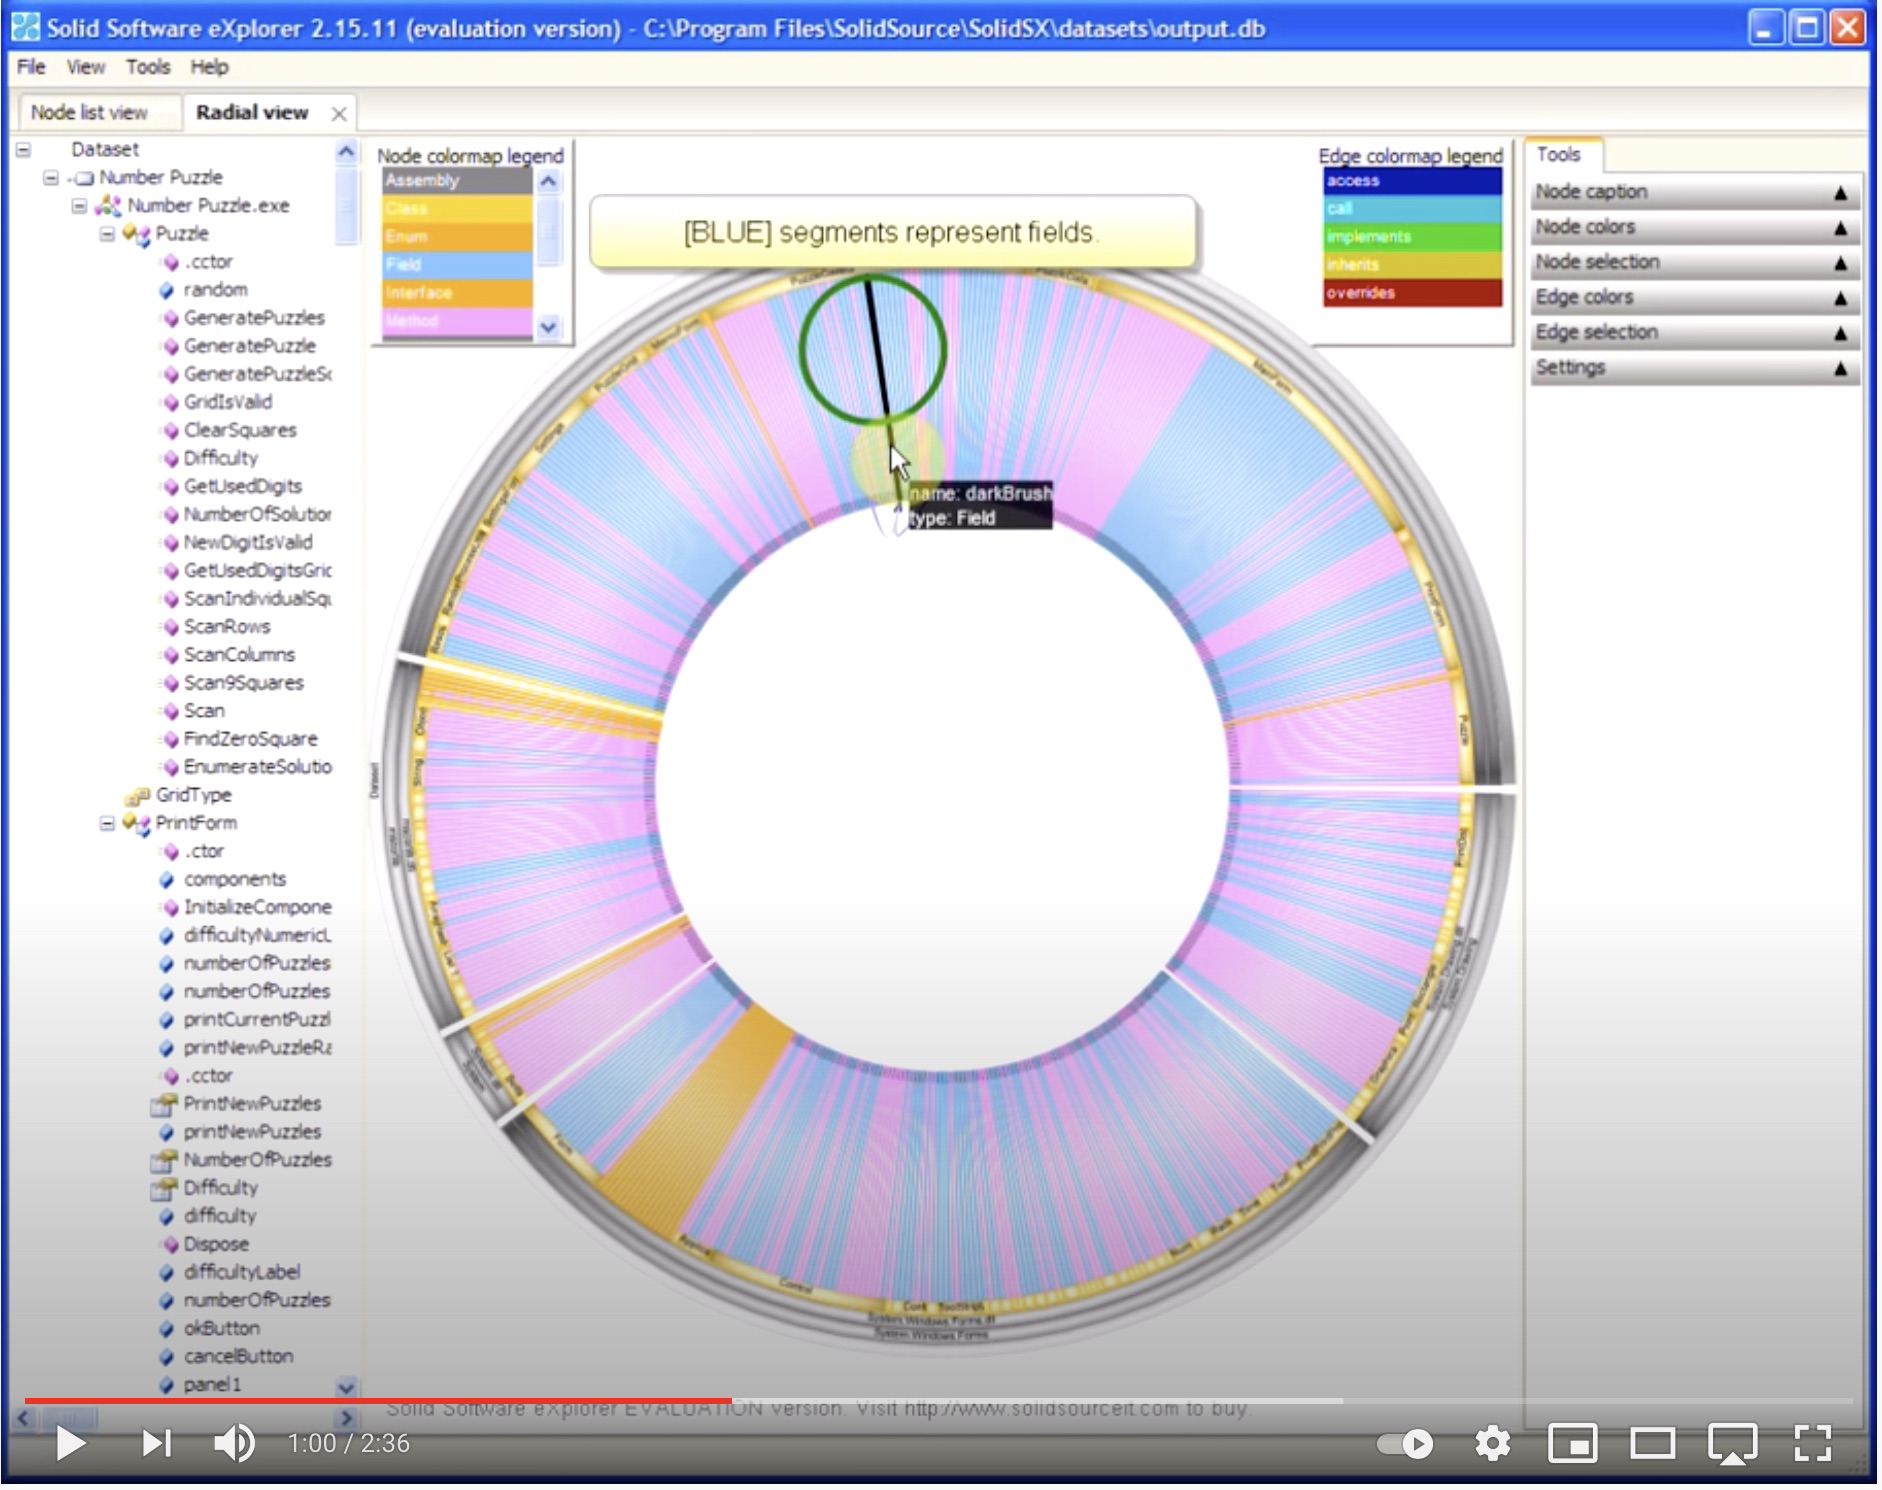
A freely available version of SolidSX is available here. This version can, among others, import structure-and-dependency graphs from .NET assemblies and Microsoft Visual Studio .pdb (program dependency) database files. As such, it can be used to readily visualize the structure of C, C++, C#, and .NET programs.
Acknowledgements
We thank dr. Dennie Reniers for making his visualization code available to us for implementing our multiscale bundles and dr. Danny Holten for supplying us with the migrations force-bundled layout. The original idea of using skeletons for graph visualization emerged from discussions with prof. Guy Melancon.
Publications
The Solid* Toolset for Software Visual Analytics of Program Structure and Metrics Comprehension: From Research Prototype to Product D. Reniers, L. Voinea, O. Ersoy, A. Telea, Science of Computer Programming, vol. 79, pp. 224-240, Elsevier, 2014
Image-Based Edge Bundles: Simplified Visualization of Large Graphs A. Telea, O. Ersoy, Comp. Graphics Forum 29(3), 2010, 2nd Best Paper Award, EuroVis'10
SolidSX: A Visual Analysis Tool for Software Maintenance D. Reniers, A. Telea, L. Voinea. Proc. EuroVis'10, short presentation and poster, 2010
Comparison of Node-Link and Hierarchical Edge Bundling Layouts: A User Study A. Telea, O. Ersoy, H. Hoogendorp, D. Reniers. Proc. Dagstuhl Seminar 09211 Visualization and Monitoring of Network Traffic, 2009