Visual Analytics

Visual analytics combines information visualization, interactive system design, data mining, data querying, and machine learning to propose tools that help analysis to solve complex data-intensive problems in a wide range of domains. While the above-mentioned underlying techniques can be seen as enabling technologies, visual analytics provides higher-level methods and tools for solving real-life problems that require iterative analyses of complex data from multiple viewpoints.
Visual analytics (VA) is by excellence best done in combination with concrete real-world problems, data, use-cases, and stakeholders. We developed several visual analytics research directions covering the following application domains:
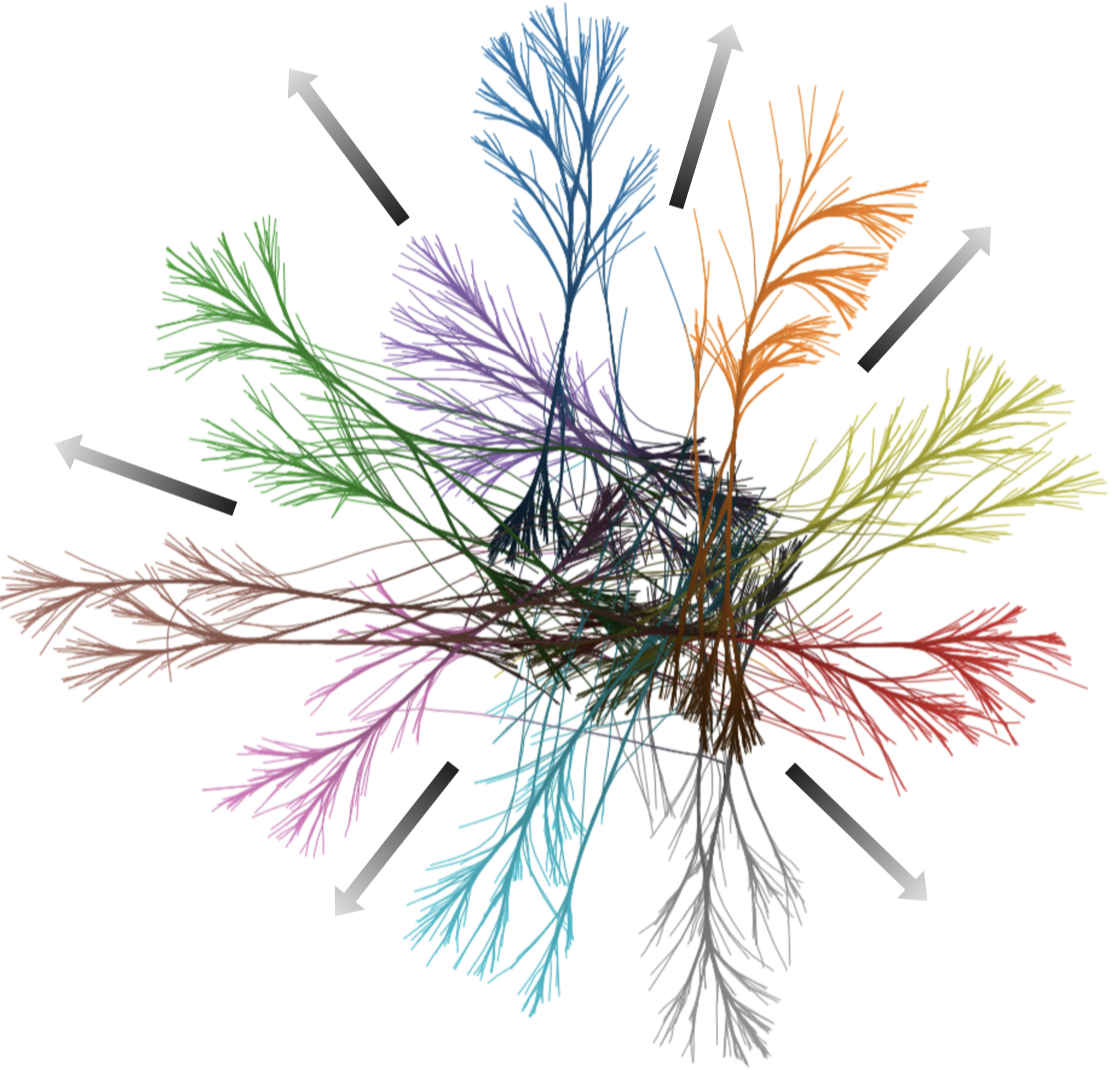
- Program comprehension: VA combines source code static analysis, fact extraction, quality metric computation, and repository mining to answer questions that support corrective, perfective, preventive, and adaptive software maintenance. We call this Software Visual Analytics (more here).
- Classifier engineering: VA combines high-dimensional data visualization with machine learning techniques (feature scoring, classifier design, data clustering) to help designers construct and improve better tools for supervised learning.
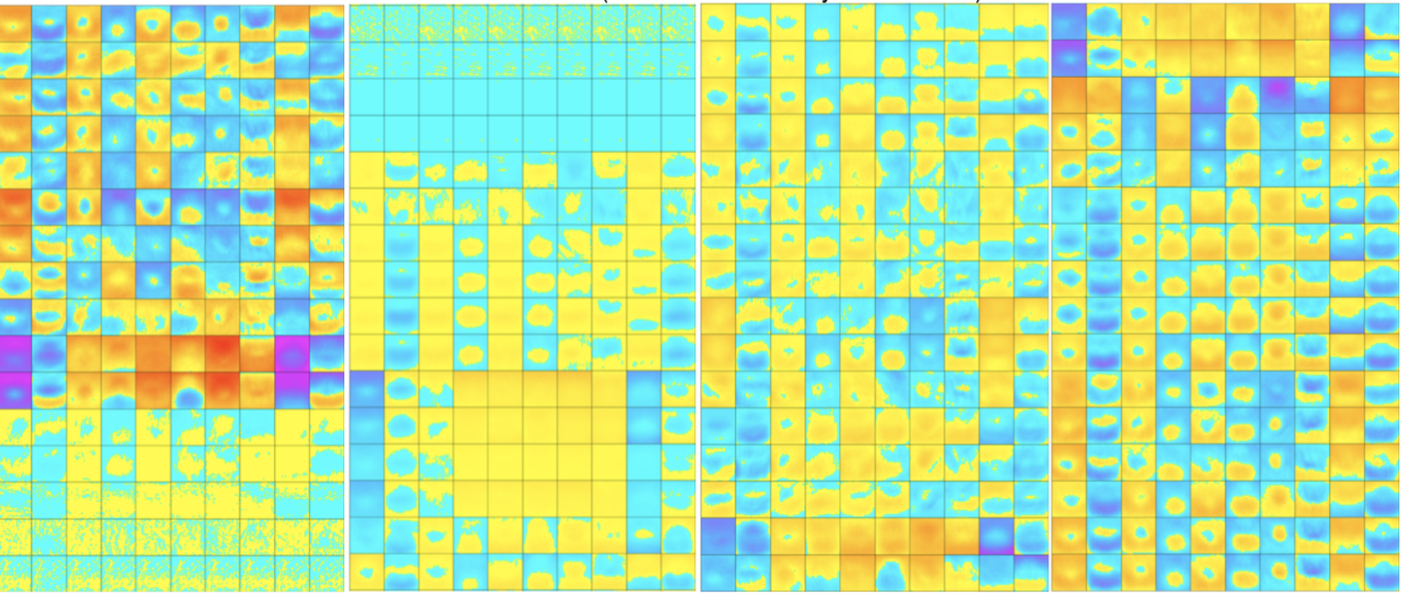
- Deep learning explanation: Generalizing the above, VA uses the same techniques to 'open the black box' of deep learning and explain why neural networks behave the way they do (what they learn, how they learn, when and why they get confused, and how they can be optimized).
To learn more
Follow the links on the left side bar to specific projects.
