Information Visualization
Information visualization aims to depict data that is by nature non-spatial, abstract, and potentially discrete. Examples are networks, data tables, text, and software source code.
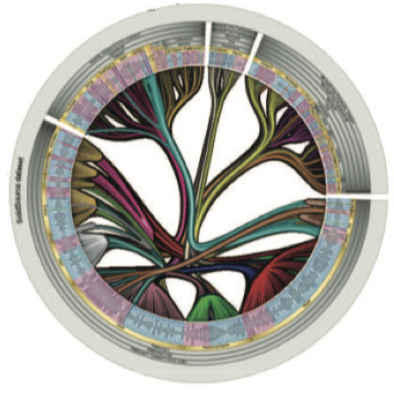
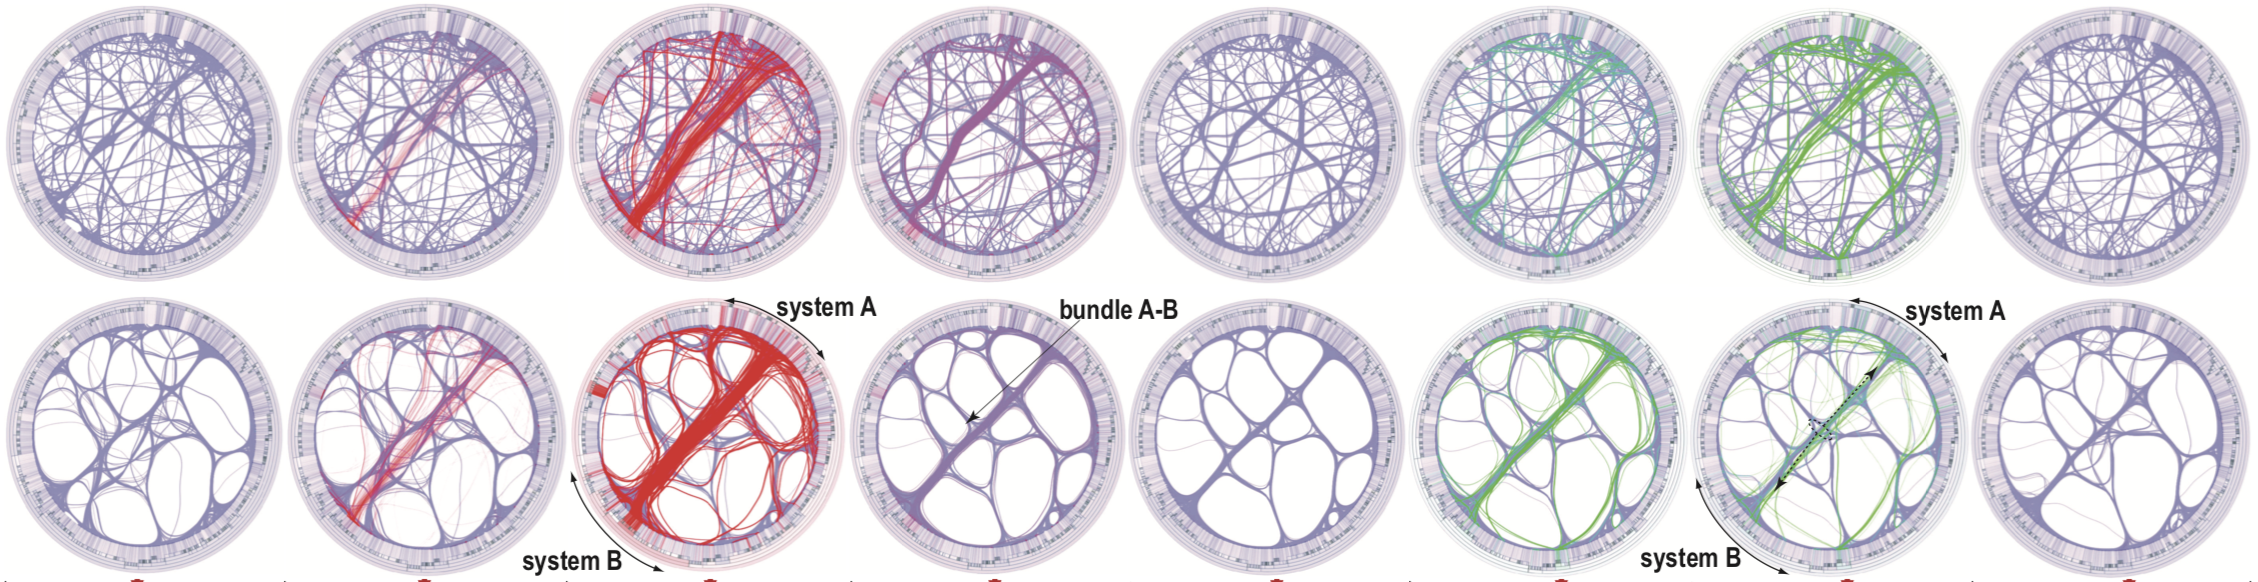
A key driver of our research is the use of image-based techniques. Putting it simply, these aim to depict infovis data using similar metaphors as present in classical scientific visualization, or more generally, in photorealistic computer graphics or imagery. Examples are smooth shapes, subtle lighting, color gradients, and space-filling displays where every pixel conveys information. This way, we can encode data by natural shapes, which are easier to understand, and also have a multiscale nature (that is, can be zoomed in/out to show more details, respectively show big data).
Specific use-cases and applications of our infovis research:
- large multivariate graphs and networks
- time-dependent trail sets and graphs
- high-dimensional data
- large data tables
- multivariate software data (code, structure, behavior, evolution, quality metrics)
To learn more
For more information, visit the links in the left sidebar.