Smooth Bundling of Large Streaming and Sequence Graphs
Problem
Visualizing large graphs is challenging due to clutter and overdraw. For static (time-independent) graphs, bundling offers an excellent solution by visually simplifying the graph depiction. How to extend bundling to dynamic graphs?
Streaming graphs
A streaming graph is simply a graph where nodes and edges have a lifetime. They appear at some moment in time, live for a while, and next disappear. The evolution of such graphs is potentially infinite, as new nodes/edges can appear in the future.
We bundle streaming graphs by a surprisingly simple modification of our kernel density bundling method (KDEEB) for static graphs: We let the advection process responsible for bundling run in an infinite loop, simply 'drop in' edges when these appear in the graph stream, and remove them from the density estimator when their lifetime ends.
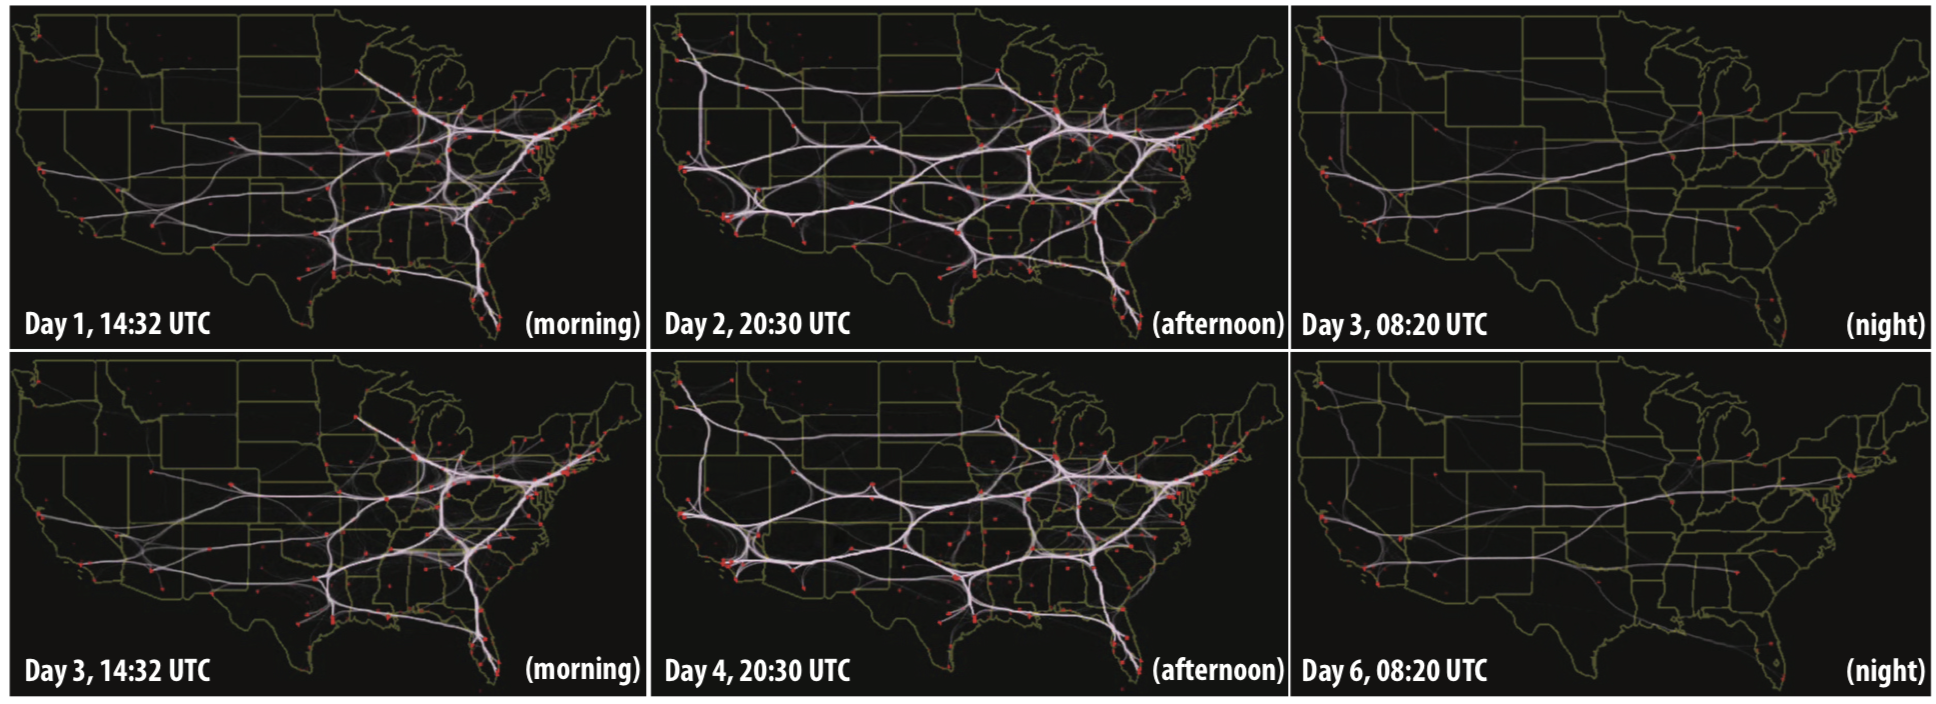
The image below shows six snapshots of a streaming graph depicting flights over North America over a period of 6 days (41K edges in total). The dynamic bundling runs in real time thanks to the GPU implementation of KDEEB and shows organic bundle structures smoothly changing over time.

A video of the dynamic bundling of this dataset is below.
Sequence graphs
A sequence graph is a sequence of individual graphs having correspondences between edges in consecutive graphs. In contrast to a streaming graph, we now don't have edges with a start and end time (defined over the continuous time domain), but correspondences between pairs of edges in discrete graphs. Sequence graphs emerge, for example, from mining dependencies from revisions of software repositories.
We bundle sequence graphs by separately bundling each graph in the sequence (using any desired static bundling algorithm) and next interpolating corresponding edge pairs with suitable fade-in and fade-out blending to create smooth transitions.
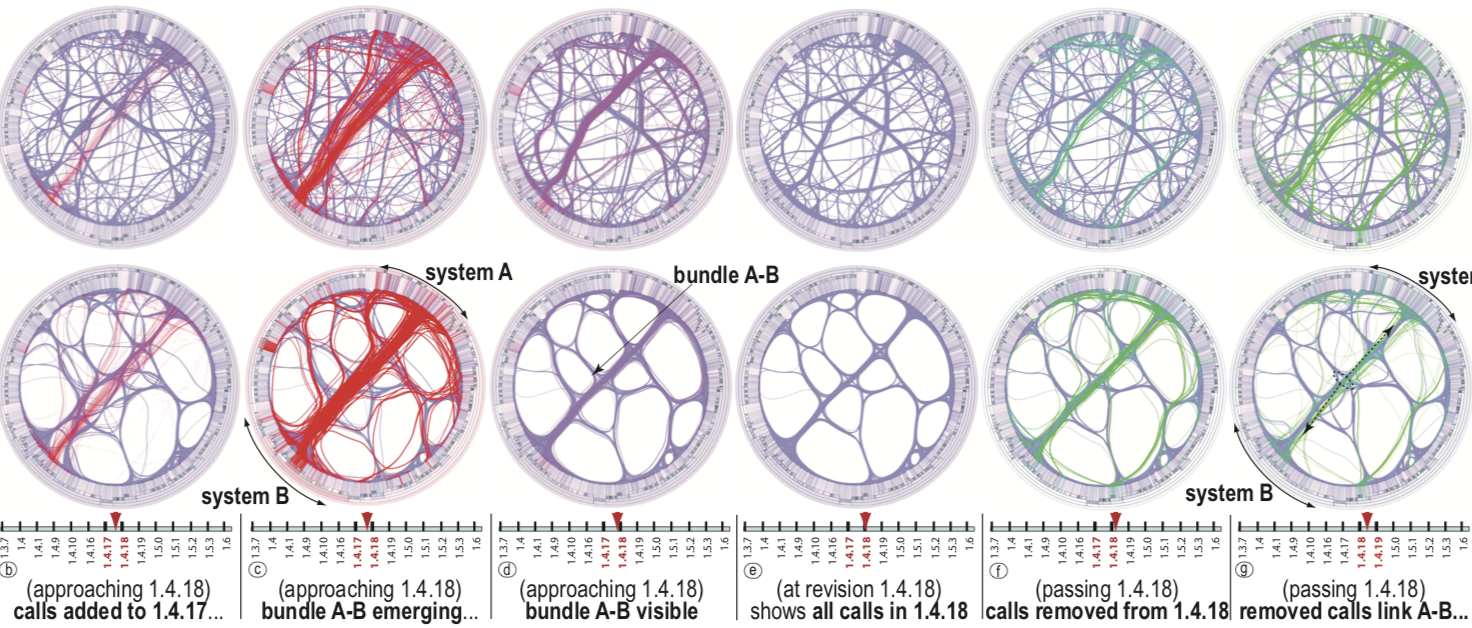
The image below shows the bundling of a sequence graph containing 92810 edges (function calls) extracted from 14 revisions of the Wicket code base. The top row uses SBEB bundling. The bottom row uses KDEEB bundling.
Red indicates calls inserted at some moment in time; green indicates calls removed. We see an interesting pattern of many calls being first inserted, then removed, between the same software components. Upon closer analysis, this indicates some massive refactoring events.

A video of the dynamic bundling of this dataset is below
Implementation
Our streaming and sequence bundling methods are very simple to implement, work for any generic dynamic graph, and can handle graphs up to one million edges in real-time on a modern PC.
Publications
Smooth Bundling of Large Streaming and Sequence Graphs C. Hurter, O. Ersoy, A. Telea. Proc. PacificVis, 2013, Honorable Mention Paper Award
