Dynamic graph bundling
Visualizing large graphs is, in itself, a challenging problem. However, when such graphs change, the problem becomes even greater. Getting insight into "structural" graph changes is useful: For example, for software systems, such changes help finding so-called "refactoring" events (code fragments or dependencies that changed during the system evolution).
Bundling solution
To address the above problem, we extended KDEEB, a graph bundling algorithm for static graphs to the case of dynamic graphs. Depending on the graph type, we covered two cases, as described below.
Streaming graphs
"Streaming graphs" are sequences of edges annotated with lifetime start and end moments. They model graphs that continuously change, in contrast to graph sequences (described below).
We visualize streaming graphs by extending KDEEB to progressively bundle edges as they appear in the stream, and unbundle them as they disappear. KDEEB works by iteratively shifting edges upstream in their density gradient (similar to mean shift). Hence, extending KDEEB to streaming graphs is very simple and computationally efficient.
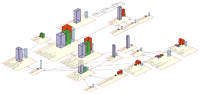
The video below shows a dynamically bundled streaming graph of US flights over a period of three days (41K edges in total).
Sequence graphs
"Graph sequences" are ordered sets of standalone graphs. All edges of a graph in such a sequence logically belong together. In contrast to streaming graphs, there are no explicit edge timestamps.
We visualize sequence graphs by extending KDEEB to smoothly interpolate between consecutive graphs in a sequence. For this, we need to first identify corresponding edges in consecutive graphs. We do this by using application-specific information, such as edge annotations or attributes.
The video below shows a sequence graph animation of 22 graphs. Nodes are files in 22 revisions of the Wicket software code base. Edges in each graph are clone relations between the source files in that revision. Edge colors indicate persistent clones (blue), clones that are removed (green), and clones that are added (red). The animation helps finding the persistent clone subset (blue), and also see how refactorings add and remove clones.
References
For more information on the dynamic KDEEB bundling, see Hurter et al., 2012.
Acknowledgements
This work was done in collaboration with Christophe Hurter, ENAC/University of Toulouse, France.