Programmable Software Visualization
Software visualization is an effective instrument in many software maintenance activities such as reverse engineering, architectural recovery, refactoring, and overall system understanding. Many dedicated software visualization tools exist for specific tasks. However, one often encounters cases when a new kind of visualization is needed, which involves the design of new data models, layouts, graphical metaphors, and interaction schemes. Developing all these components from scratch can be a costly proposition.
The SoftVision Framework
SoftVision was designed with the aim of helping developers in quickly setting up new software visualization applications. The framework includes several components which can be easily assembled and customized with minimal effort to create new software visualization applications. SoftVision is designed around a relational data model, in which software is represented as an attributed graph. The main components include:
- a generic entity-relationship data model supporting an open set of attributes per node/edge
- graph processing algorithms (editing, traversal, search)
- layout algorithms (hierarchical trees, graphs, and nested graphs)
- customizable 2D and 3D node and edge glyphs
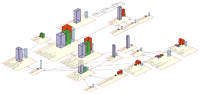
- 2D and 3D interactive visualizations based on OpenInventor
- customizable user actions
- customizable graphical user interfaces
- all operations are scriptable using Tcl/Tk
The Software
SoftVision is available under Microsoft Windows as follows
Applications
The SoftVision framework has been developed with support from Nokia Research Center, Helsinki, Finland, and used for software visualizations in reverse engineering and reverse architecting. We thank dr. Alessandro Maccari and dr. Claudio Riva for their support in this project.
Publications
Several publications describe the use of SoftVision in software visualization and relational data visualization. See publications 51, 49, 47, 37, 34, 30, 26, and 25 here.