Software Evolution Visualization
Software changes in time. For industrial projects, millions of lines of code are written by teams of tens of people in tens of releases over several years. As software maintenance accounts for over two thirds of the software engineering life-cycle costs, many questions target understanding the evolution of source code, design documents, and other related artifacts.
Within this topic, we study how to answer several questions related to the evolution of software, with a focus on source code. The approach is multiscale: We consider source code at the level of lines, syntax structures, components, files, and entire systems.
Line-level evolution visualization
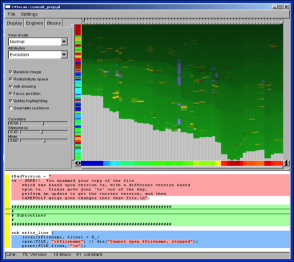
Consider a single source file in a software repository. We are interested to see how its individual lines of code have been added, modified, and deleted as the file was changed. The image below shows an evolution of a file over 64 versions from the VTK code base. Each green vertical bar in the top view shows a file version. Small yellow, blue, and red blocks show events such as edit, delete, and insert. The bottom code view shows the actual code under the mouse in the top view.
The software for this project, called CVSscan, is available here.
Syntax-level evolution visualization
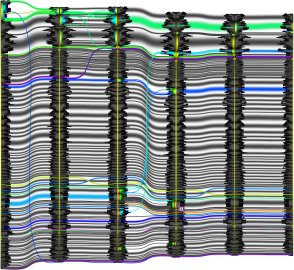
Consider the same scenario as above. Now we are interested to see how syntactic structures, such as functions, classes, or individual statements, have changed. The image below shows an evolution of a C++ file over 6 versions. Colored tubes connect changed code between consecutive versions. Gray tubes connect unchanged code.
File-level evolution visualization
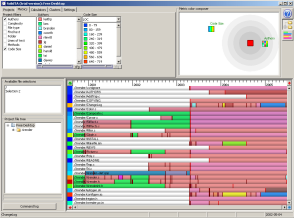
Consider now an entire software repository, such as Subversion or CVS. We are interested to see how each file in the repository changed in time, who modified it, and whether there are change correlations between different files. The image below shows CVSgrab, an integrated visualization tool for the analysis of large repositories. Each horizontal stripe in the main view shows the evolution of a single file. Each color block in a stripe indicates a file version, colored by a given attribute such as author identity, file size, or file type. The horizontal axis indicates time.
The software for this project, called CVSgrab, is available here.
Industrial solution
The repository-level visualization described above was also implemented in an industry-grade, commercial tool: SolidTA. SolidTA offers the same basic functionality as CVSgrab, but has several scalability optimizations, and supports data mining from CVS, Subversion, and Git repositories.
A freely-usable copy of SolidTA for Windows can be obtained here.
Putting it all together
All the above techniques are integrated with a client-side tool that allows data extraction, metric computation, and incremental visual exploration of industry-size software repositories such as CVS, Subversion, and Git. This independently-maintained tool is available here.
Dependency evolution
Work on the evolution of dependencies in software is described separately here.
Publications
The techniques described here are detailed in publications 125, 105, 97, 89, 82, 80, 75, 70, and 67 available here. For a comprehensive overview, see the PhD thesis of Lucian Voinea.