Mining and Visualizing Program Trace Differences
Introduction
'Program traces' represent massive sets of events recording the dynamic behavior of software. Analyzing traces reveals many important patterns, such as performance, security, or correctness problems.
Comparing traces
Often, we can find program problems only by comparing two or more different traces. Finding our the differences between such traces helps highlighting potential problem causes, and also locate the code areas and/or data values responsible for such problems. However, this is not trivial to do for traces consisting of millions of elements (e.g. function invocations)
TraceDiff tool
We have developed a visual data mining and analysis tool for the scalable comparison of program traces. Our tool has the following main features
- scalability: similar event-sets over traces are efficiently detected and stored in a hierarchy for scalable processing and investigation;
- robustness: similar event-sets are detected using a fuzzy (tolerant) approach that allows for increasingly large variations to exist at increasingly courses scales;
- ease of use: trace-comparison results can be visually and interactively examined and queried, allowing users to pose/refine questions at various levels of detail.
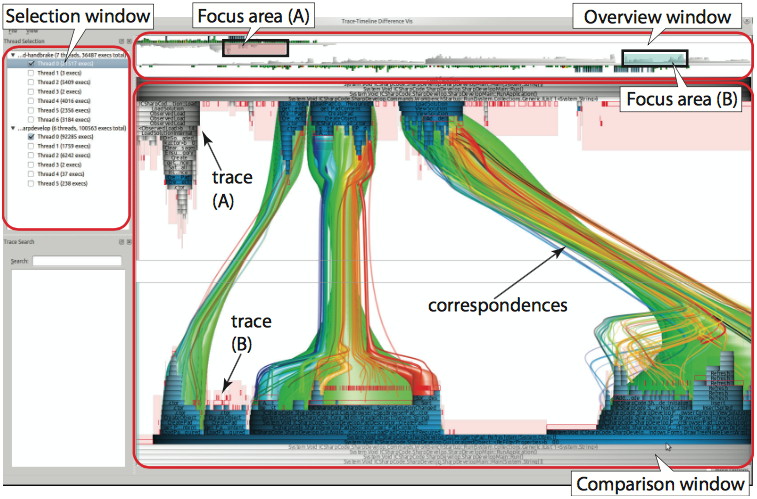
The image below illustrates the main features of our TraceDiff tool. Users can select two or more traces to compare (left window); next, time-ranges of significant execution differences are automatically highlighted (overview); selecting such a range shows a multiscale comparison of the two traces executions in the main comparison window.
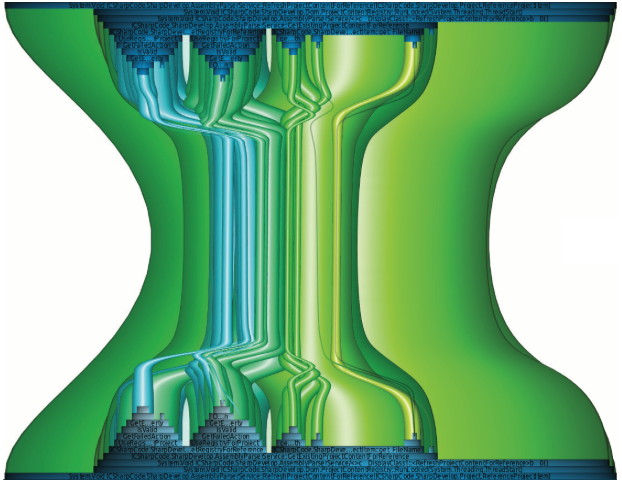
To compare traces, we developed an extended correspondence-based bundling algorithm, that is able to show both coarse-scale correspondences (matches) but also fine-scale matches in context. Our algorithm uses an extension of the classical shaded tubes method we developed earlier for multiscale compound-graph visualization. The figure below illustrates our design.
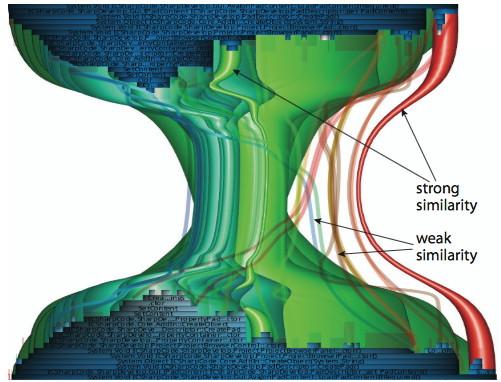
Atop of correspondences, several metrics can be mapped by color-coding, e.g. similarity or temporal order. This allows easily identifying outliers in near-similar trace sequences, as shown in the figure below.
Applications
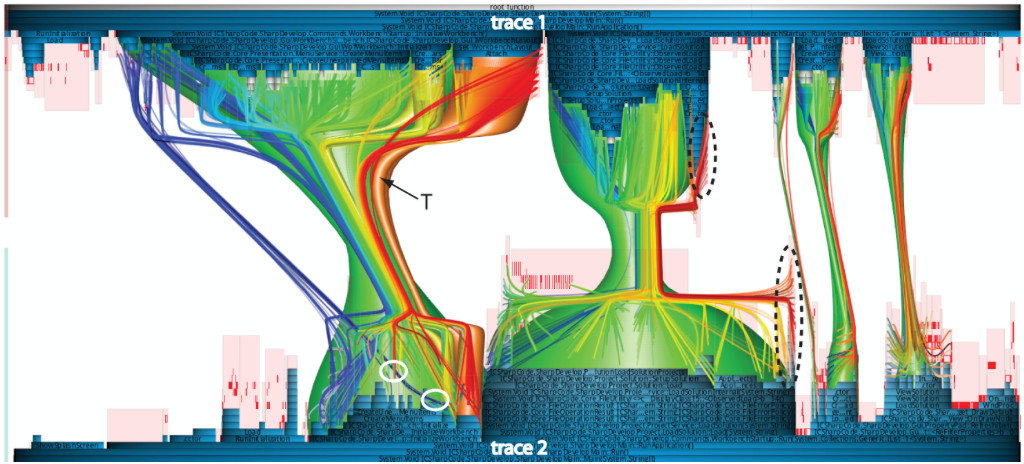
We used our TraceDiff tool to find execution-trace differences for software systems ranging up to over 1M lines-of-code and 1K function calls. For instance, running such a system with similar inputs, and next finding trace differences, allowed us spotting anomalous execution divergences which, in the end, indicate program problems (bugs or suboptimal code). The figure below shows a snapshot from such a large-program trace comparison. Color encodes function call moments. Shifts in the blue-to-red color gradient indicate permutations in the function-call order, which in turn indicate execution problems.
Publications
Multiscale Visual Comparison of Execution Traces J. Trümper, J. Doellner, A. Telea. Proc. ICPC, 2013
Additional information
This work was done in collaboration with Jonas Trümper and prof. Jürgen Döllner (Computer Graphics Group, HPI, University of Potsdam, Germany).
The TraceDiff correspondence algorithm is further maintained and used by the SoftwareDiagnostics company.
For more details on ViewFusion, please contact its main developer and maintainer, Jonas Trümper.
See also the talk on multiscale visualization of A. Telea delivered at HPI, Potsdam, Germany, in Feb. 2012.