Visualizing the Hidden Activity of Artificial Neural Networks
Problem
Deep learning is everywhere. But it is (still) a black box. Sometimes it works, sometimes not. When it does, why? And when it doesn't, what to do? Black boxes are hard to handle, not trustworthy, and potentially unreliable. How to see what happens inside?
Solution
We propose several visualization methods to reveal aspects of the hidden activity in deep neural networks (DNNs).
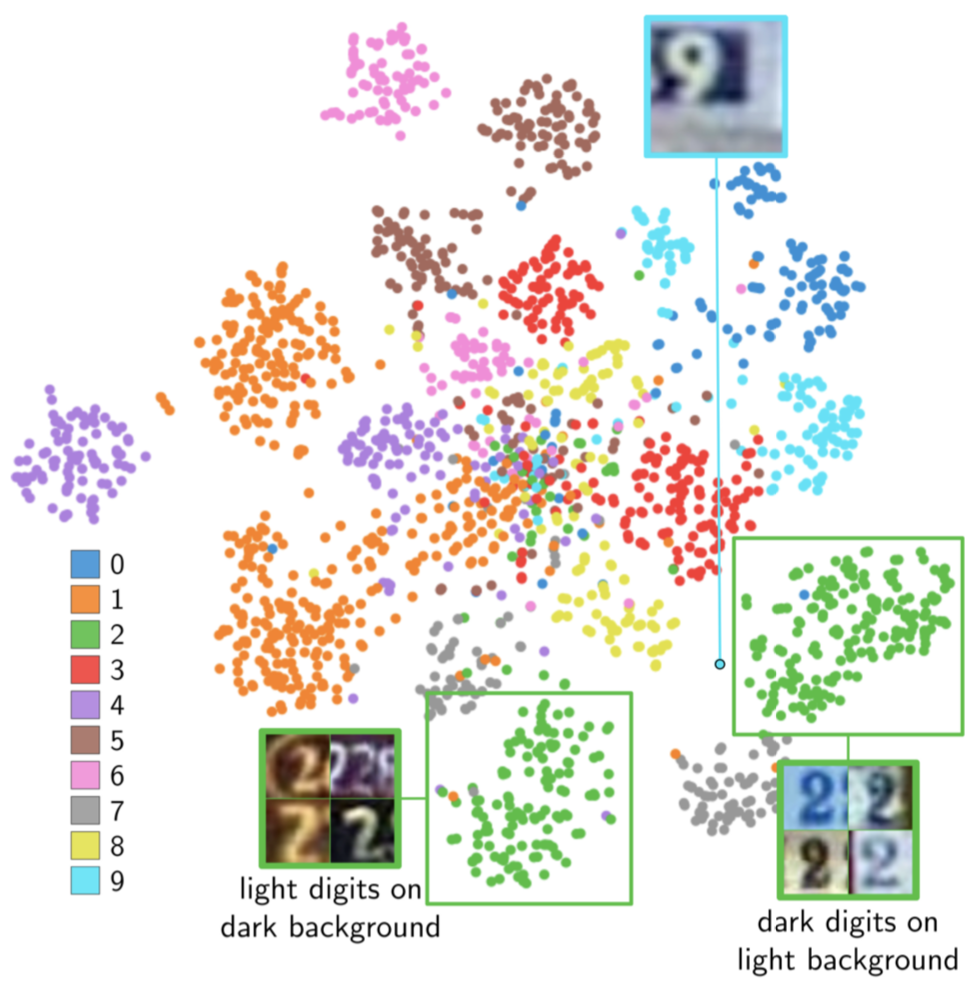
The first such method takes every observation of some dataset and projects it into 2D, based on the activations it generates in one hidden layer of a given trained DNN. The image below shows this for the well-known SVHN dataset, for a classification problem of digit images. We discover something really surprising: The DNN learned not only how to separate digits, but also how to separate bright digits on a dark background from dark digits on a bright background (every color, meaning one digit class, is roughly split into 2 clusters). This is clearly an useless thing to learn, so to improve this DNN, we'd better preprocess images to remove this luminance factor.
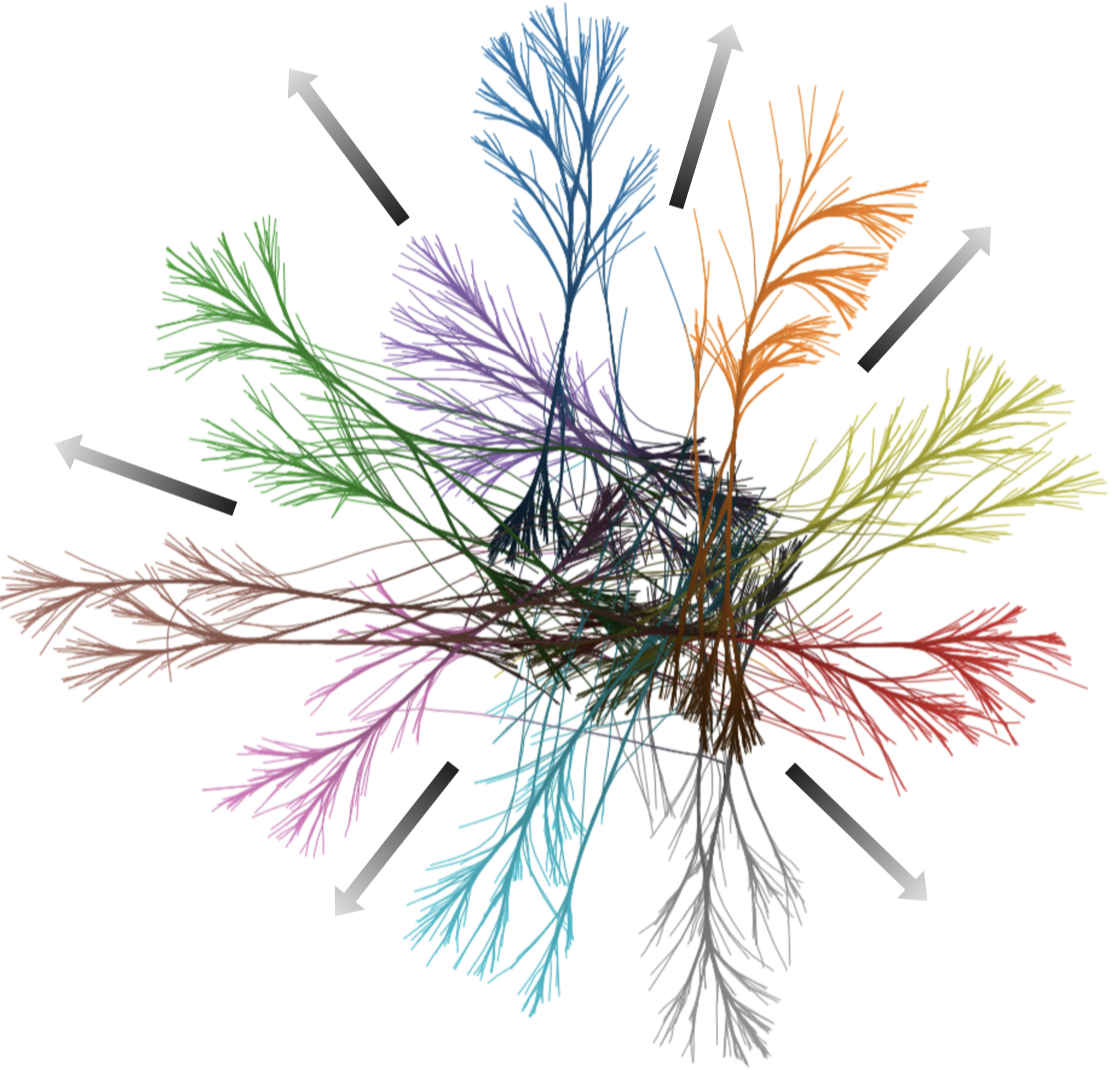
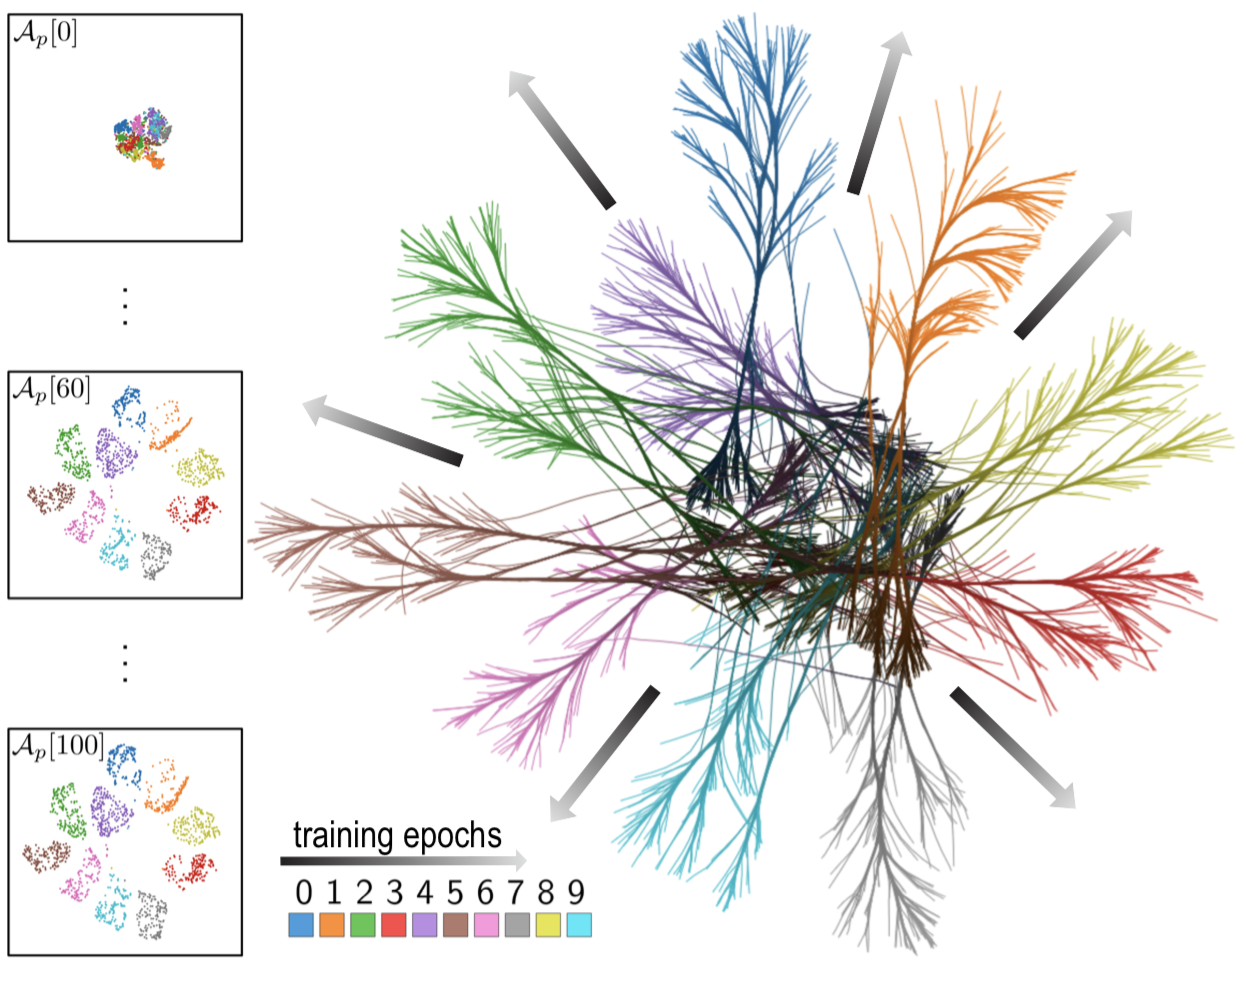
A second method looks at how a DNN progresses during training. For each training epoch, we build a similar 2D projection as above, and next connect the positions of the same observations to create trails, which we then visualize using edge bundling (to remove noise). The image below shows this for the well-known MNIST dataset. Trails are color-coded by observation class, and luminance-coded by epoch (dark=early, bright=late). We see a clear pattern: Trails fan out from a dark unstructured center (the DNN could not separate classes early on in training) to a bright well-separated set of classes (training did work well). We also see classes for which training worked less well, e.g. the purple one (class 4). Using this, we know that for better performance, we should train more with class 4 samples.
Features
Our visualizations have several desirable properties. They are
- generic, i.e., handle any neural network architecture and dataset
- simple and fast to construct
- simple to interpret
Publications
Visualizing the Hidden Activity of Artificial Neural Networks P. Rauber, S. Fadel, A. Falcao, A. Telea. IEEE TVCG (Proc. VAST), vol. 23, no. 1, pp. 101-110, 2017