Constructing Classifier Decision Boundary Maps
Problem
Constructing classifiers is one of the key tasks in Machine Learning (ML). However, how can we precisely say where a classifier will decide to call an instance as being class A instead of class B? More generally, how does a classifier partition the high-dimensional space into so-called decision zones, separated by decision boundaries?
Solution
We propose a technique for the generation of 2D visual depictions (images) of classifier decision zones and boundaries. The overall idea is simple and works as follows. Given a classifier C trained on some test-set T residing in nD,
- project T in 2D using any dimensionality-reduction technique
- for every pixel p in the 2D image, use an inverse projection technique to find the matching nD point x
- run x through C to get its label L(x)
- color p by L(x)
- optionally, color all misclassifications separately to highlight them
Results
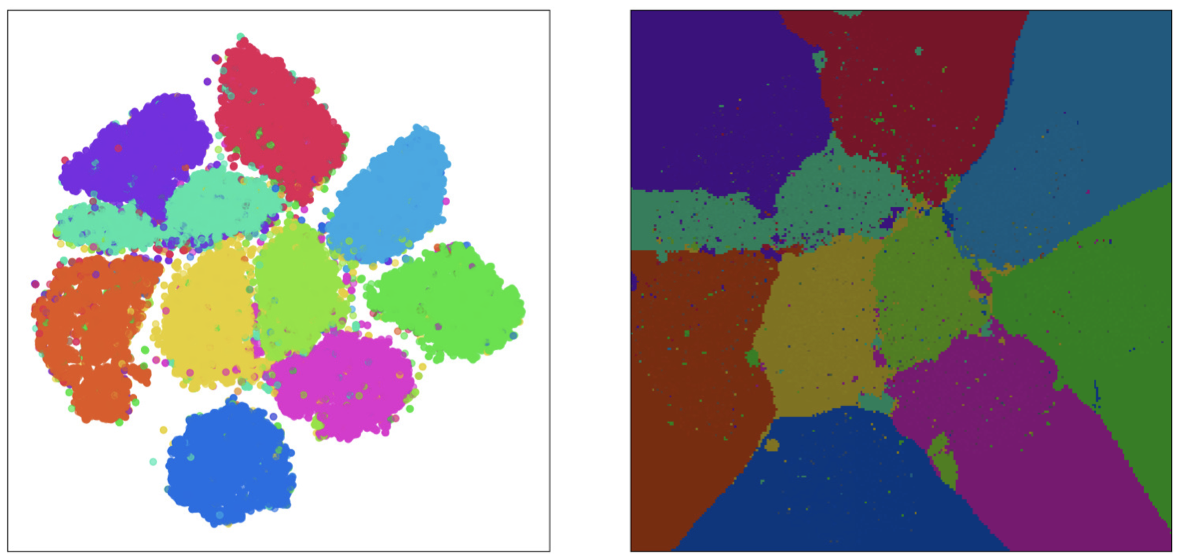
The left image below shows the well-known MNIST dataset, projected by t-SNE. The right image below shows the decision zones (compact color areas) and decision boundaries (where two color meet) computed by our method for this dataset. Our visualization extrapolates from the sparse scatterplot (left) to a dense, compact, visualization of the decision process (right).
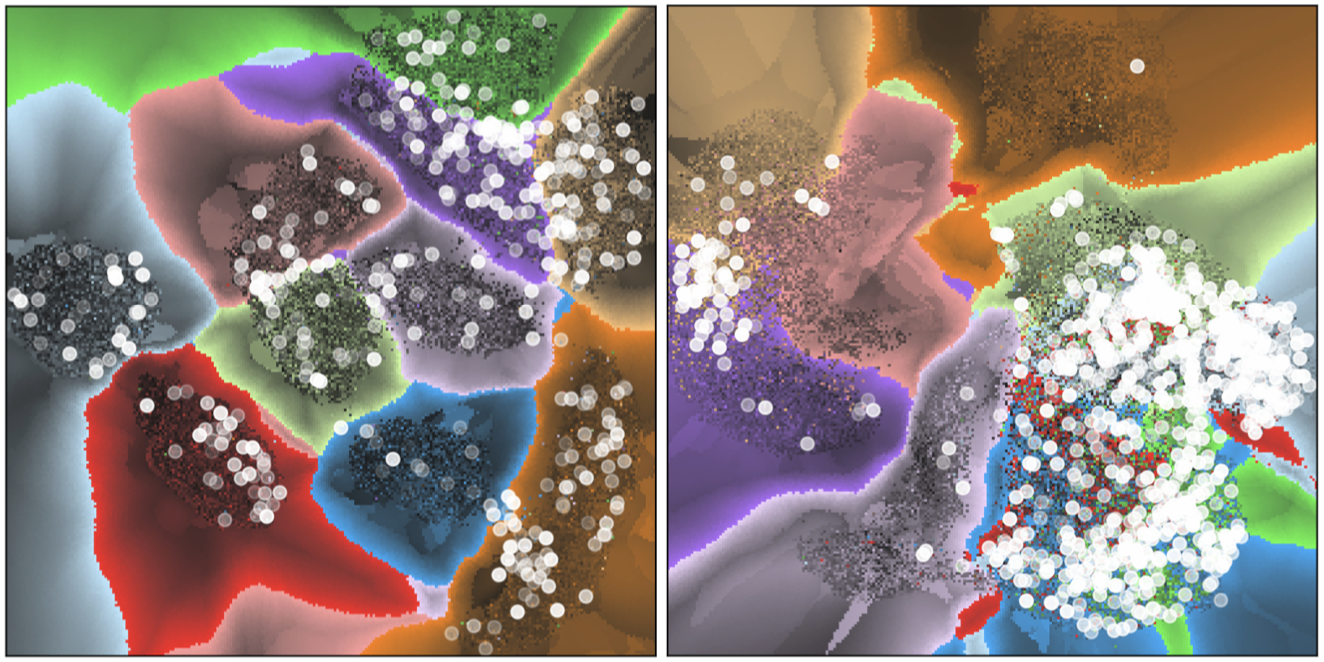
But we can do better: We can show the actual distances from a point (in the 2D image) to the closest decision boundary. This tells where in nD space we are close to a decision boundary, thus, we may encounter classification problems. The next image shows these distances (luminance-encoded) with misclassifications shown as white dots, for the well-known MNIST (left) and FashionMNIST (right) datasets. Dark Delaunay edges show points having (many) false neighbors. As visible, there are only a few such points in this projection.
Features of our technique
- works generically for any classifier, any high-dimensional dataset
- has controllable speed-vs-accuracy
- is simple to implement
References
Constructing and Visualizing High-Quality Classifier Decision Boundary Maps F. C. M. Rodrigues, M. Espadoto, R. Hirata Jr, A. Telea. MDPI Informatics, 2019
Deep Learning Inverse Multidimensional Projections M. Espadoto, F. C. M. Rodrigues, N. S. T. Hirata, R. Hirata Jr, A. Telea. Proc. EuroVA, 2019
Visual Analytics of Multidimensional Projections for Constructing Classifier Decision Boundary Maps M. Espadoto, F. C. M. Rodrigues, A. Telea. Proc. IVAPP 2019, SCITEPRESS