Neural Network Tuning Using Activation Occurrence Maps
Problem
Deep learning can deliver impressive results. However, finding the optimal architecture for a problem is hard. In contrast to hyperparameters, which can be tuned using various methods, finding the right number of layers and neurons per layer of a network for a given problem is often a trial-and-error process.
Proposal
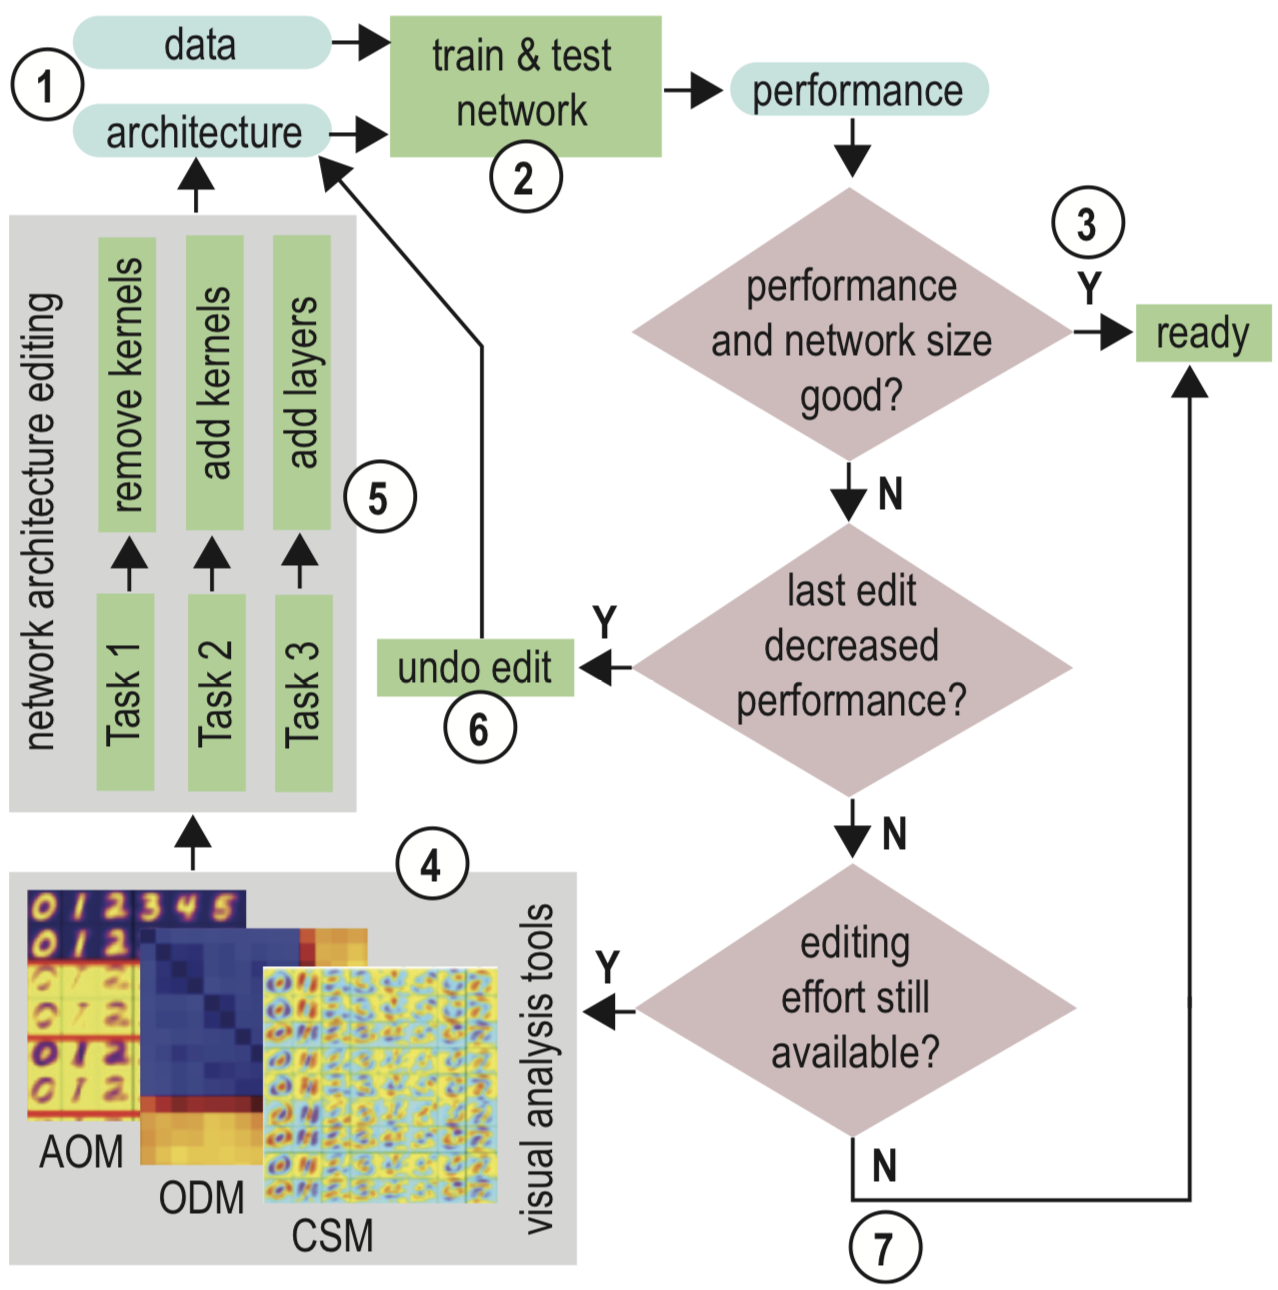
We use visual analytics (VA) to improve the performance of a given pre-trained network (for a given problem). For this, we propose several views that support the user in deciding which parts (of which layers) of a network are to be kept or adapted, to increase the model's performance. Our VA tools help with the following tasks:
- find redundant or ineffective kernels
- find too small layers
- find too shallow models
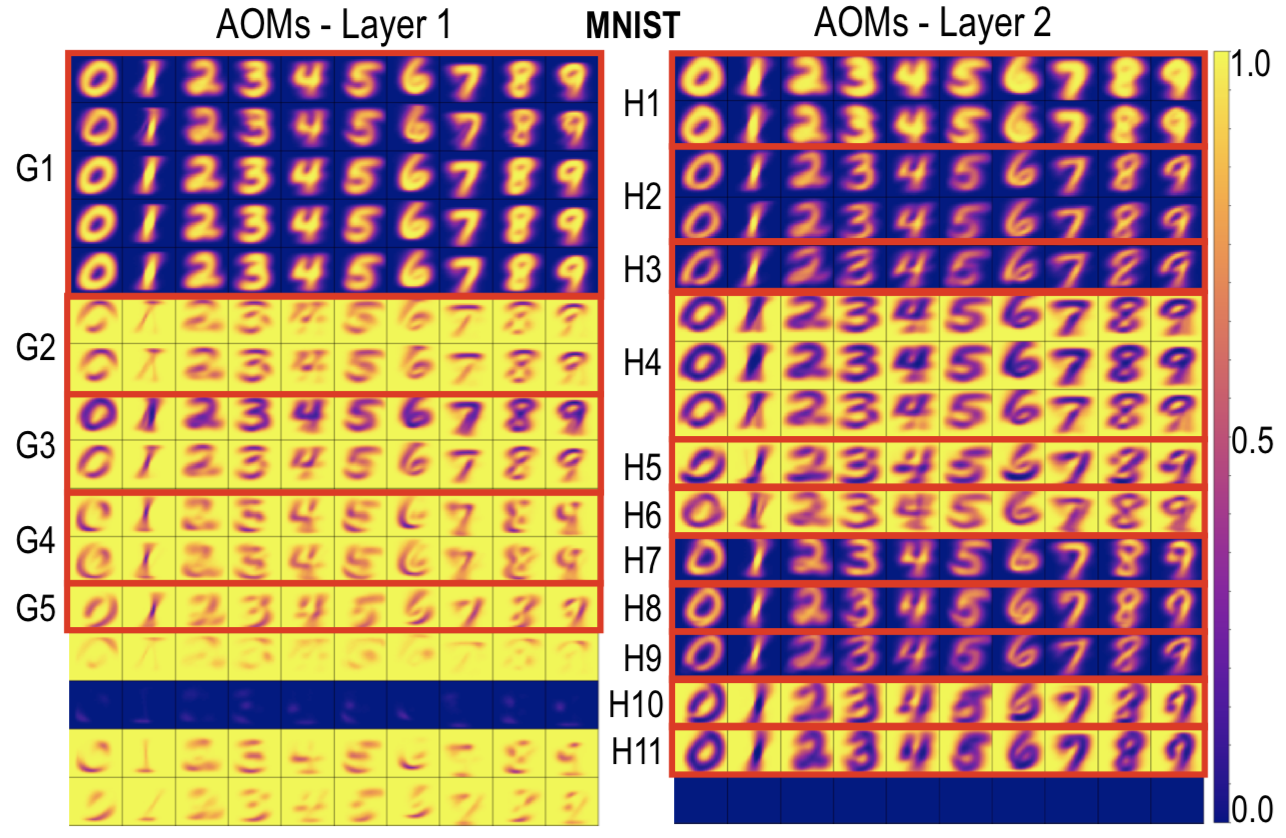
Activation Occurrence Maps
Our first view (AOMs) shows, for image data, the proportion of training images from each class activating positive values at each position in the input image data. The image below shows AOMs for 2 layers of a network trained to classify the well-known MNIST dataset. Each row represents one of the 16 kernels in the layer, while each column is a class. We notice that some kernels activate more often to specific features in the images, such as the digit structure (G1, H1), particular border orientations (G2, G4, G5), background (G3, H4), or different handwriting styles (H2, H3, H7, H9, H9).
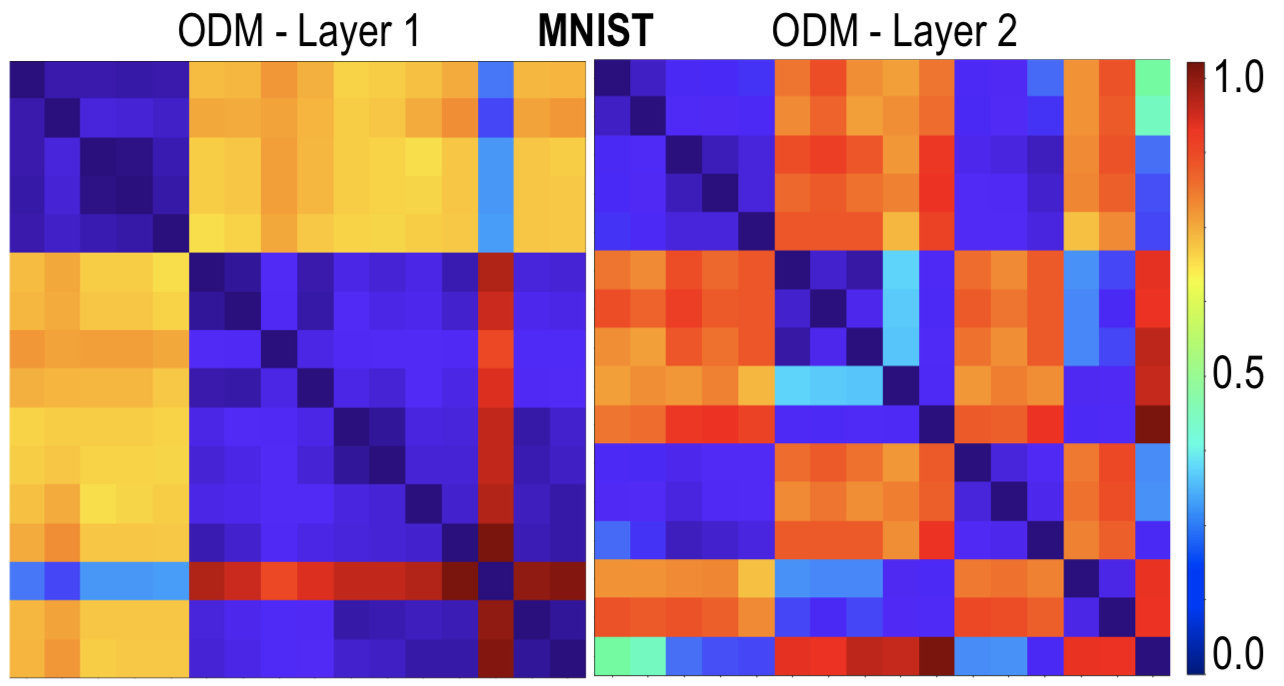
Occurrence Difference Maps
Our second view (ODMs) is a symmetric matrix displaying the average difference between the AOMs produced by each pair of kernels. It provides a concise overview of the similarities than the AOMs, with the trade-off of also providing fewer details. It can be used to search for groups of similar kernels in large layers. The image below shows ODMs for the forst 2 layers of the MNIST classification network.
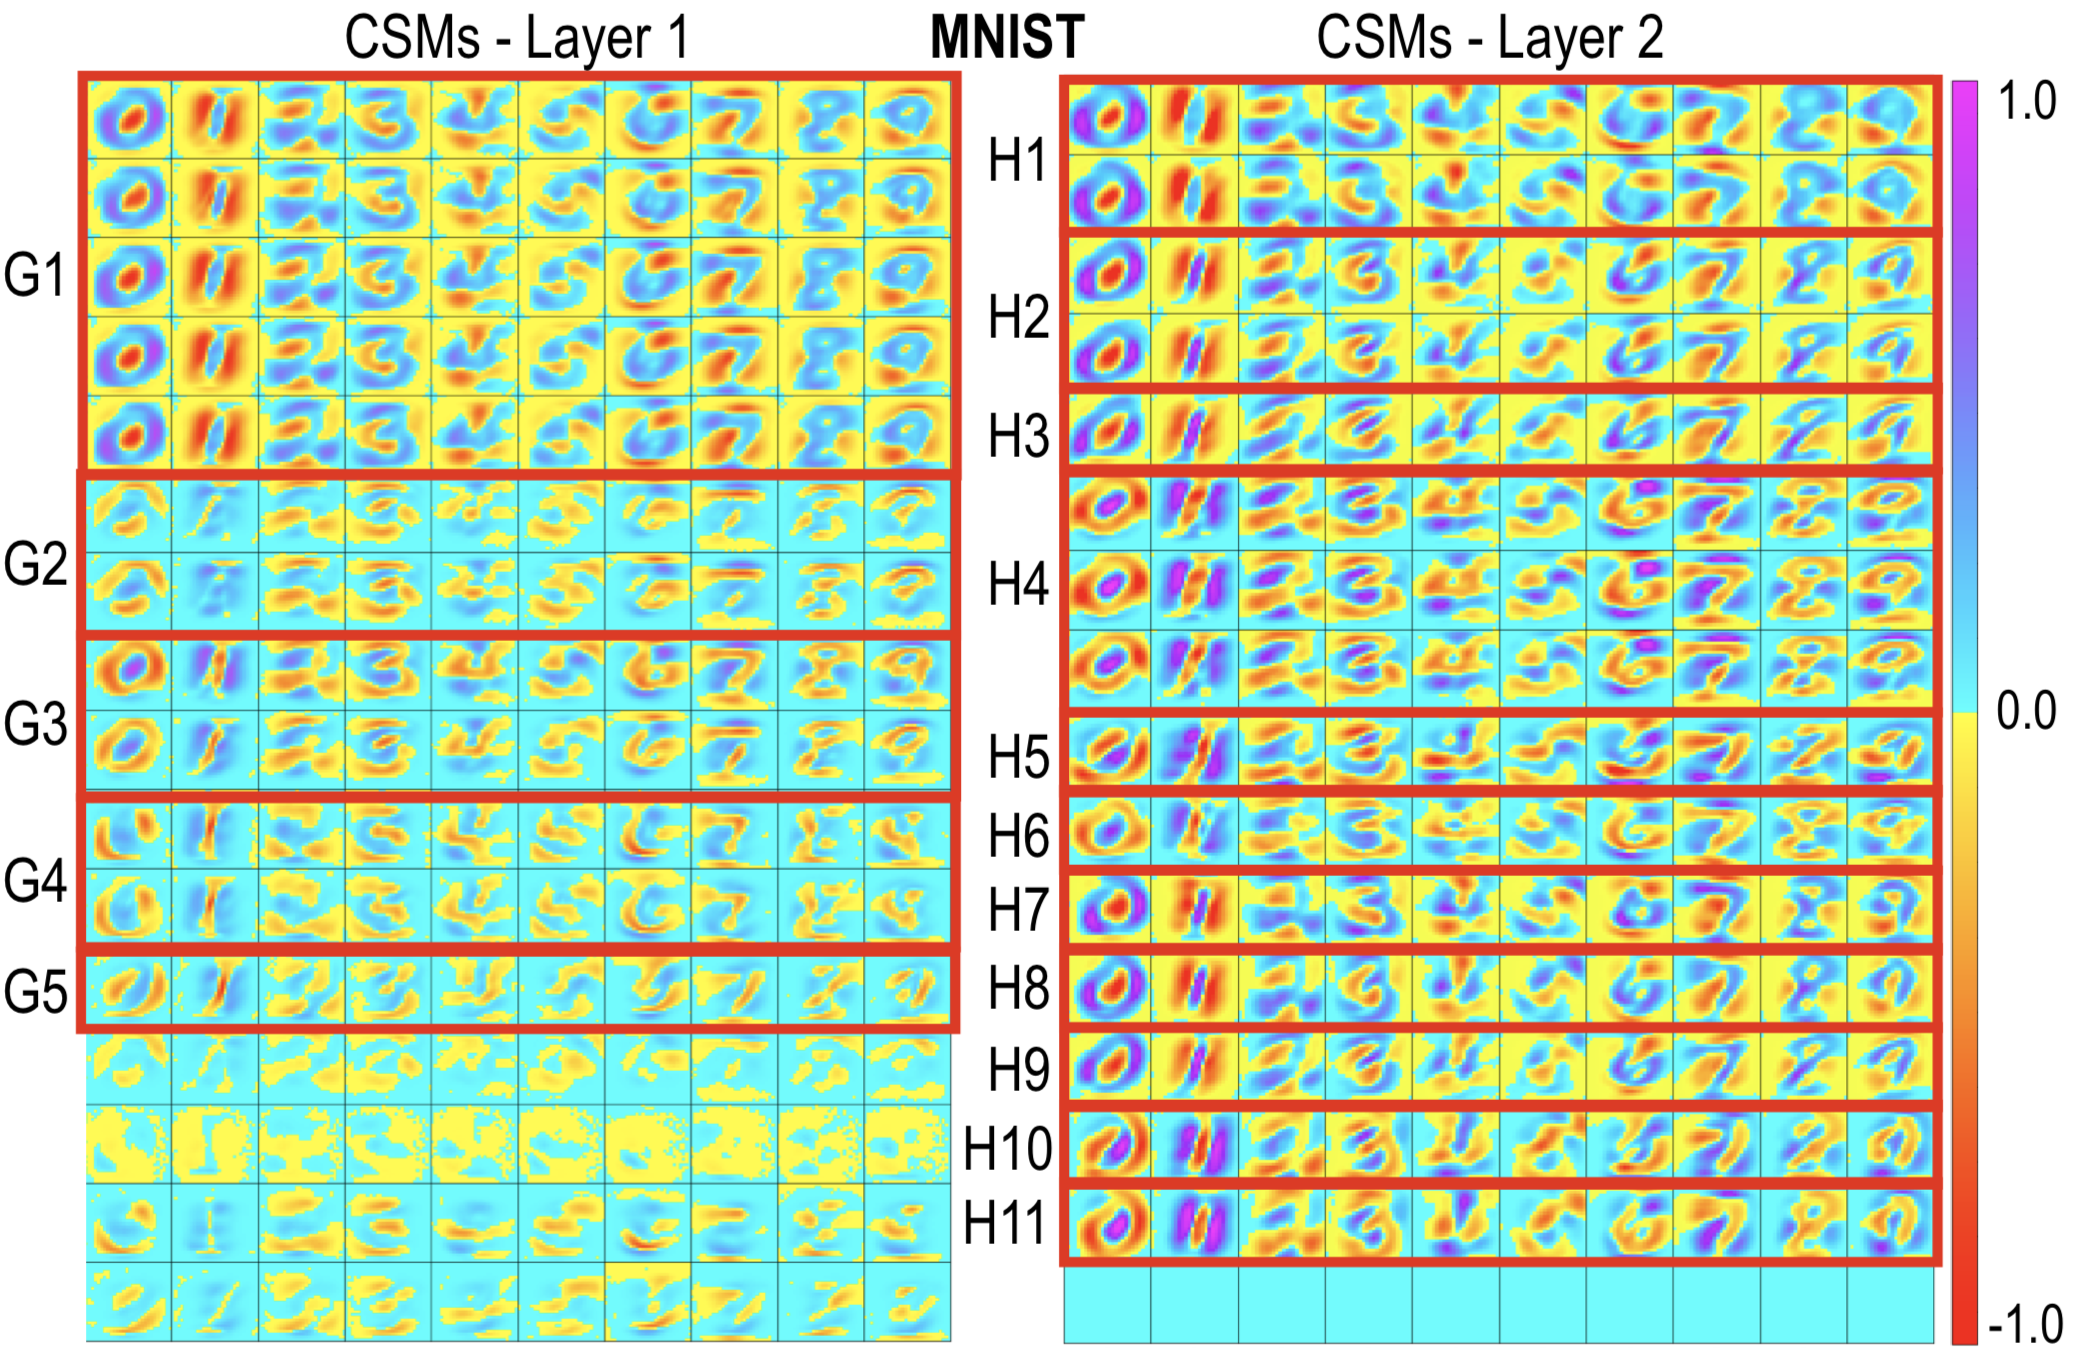
Class Selectivity Maps
Our third and last view (CSMs) shows how selective each position of a kernel’s output is towards a given class. If a position often activates for items of a given class c but does not often activate for items of any other class, this position is selective for c. The image below shows CSMs for the first 2 layers of the MNIST network. Each row represents one of the 16 kernels in each layer, while each column is a class. With this view, we can identify regions of the kernel’s output image where some classes are more selective, i.e., they activate more often than other classes. For instance, the kernels in group H1 display a strong selectivity towards round-shaped inner structures in the digits, while group H2 displays stronger selectivity towards flat shapes, such as digit one.
Publications
A Methodology for Neural Network Architectural Tuning Using Activation Occurrence Maps R. Garcia, A. Falcao, A. Telea, B. da Silva, J. Torresen, J. Comba. Proc. IJCNN, 2019