Visual Analytics in Software Product Assessment
Problem
An established world-class embedded software producer developed a product for about eight years (2002-2008). The product, maintained by 3 teams (over 60 people) covered 4.5 MLOC (over 4000 files) in embedded C and had 15 releases. However, mid 2008, they realized that their code failed to meet the customer's requests. They had two open questions: What happened wrong, and how to continue next?
The product team was unable to answer these questions satisfactorily, even though they were the most knowledgeable about the product's development history. Can we do better?
Visual analytics solution
We proposed to use a visual analytics approach to answer the above questions. For this we set up the pipeline in the image below, which works as follows
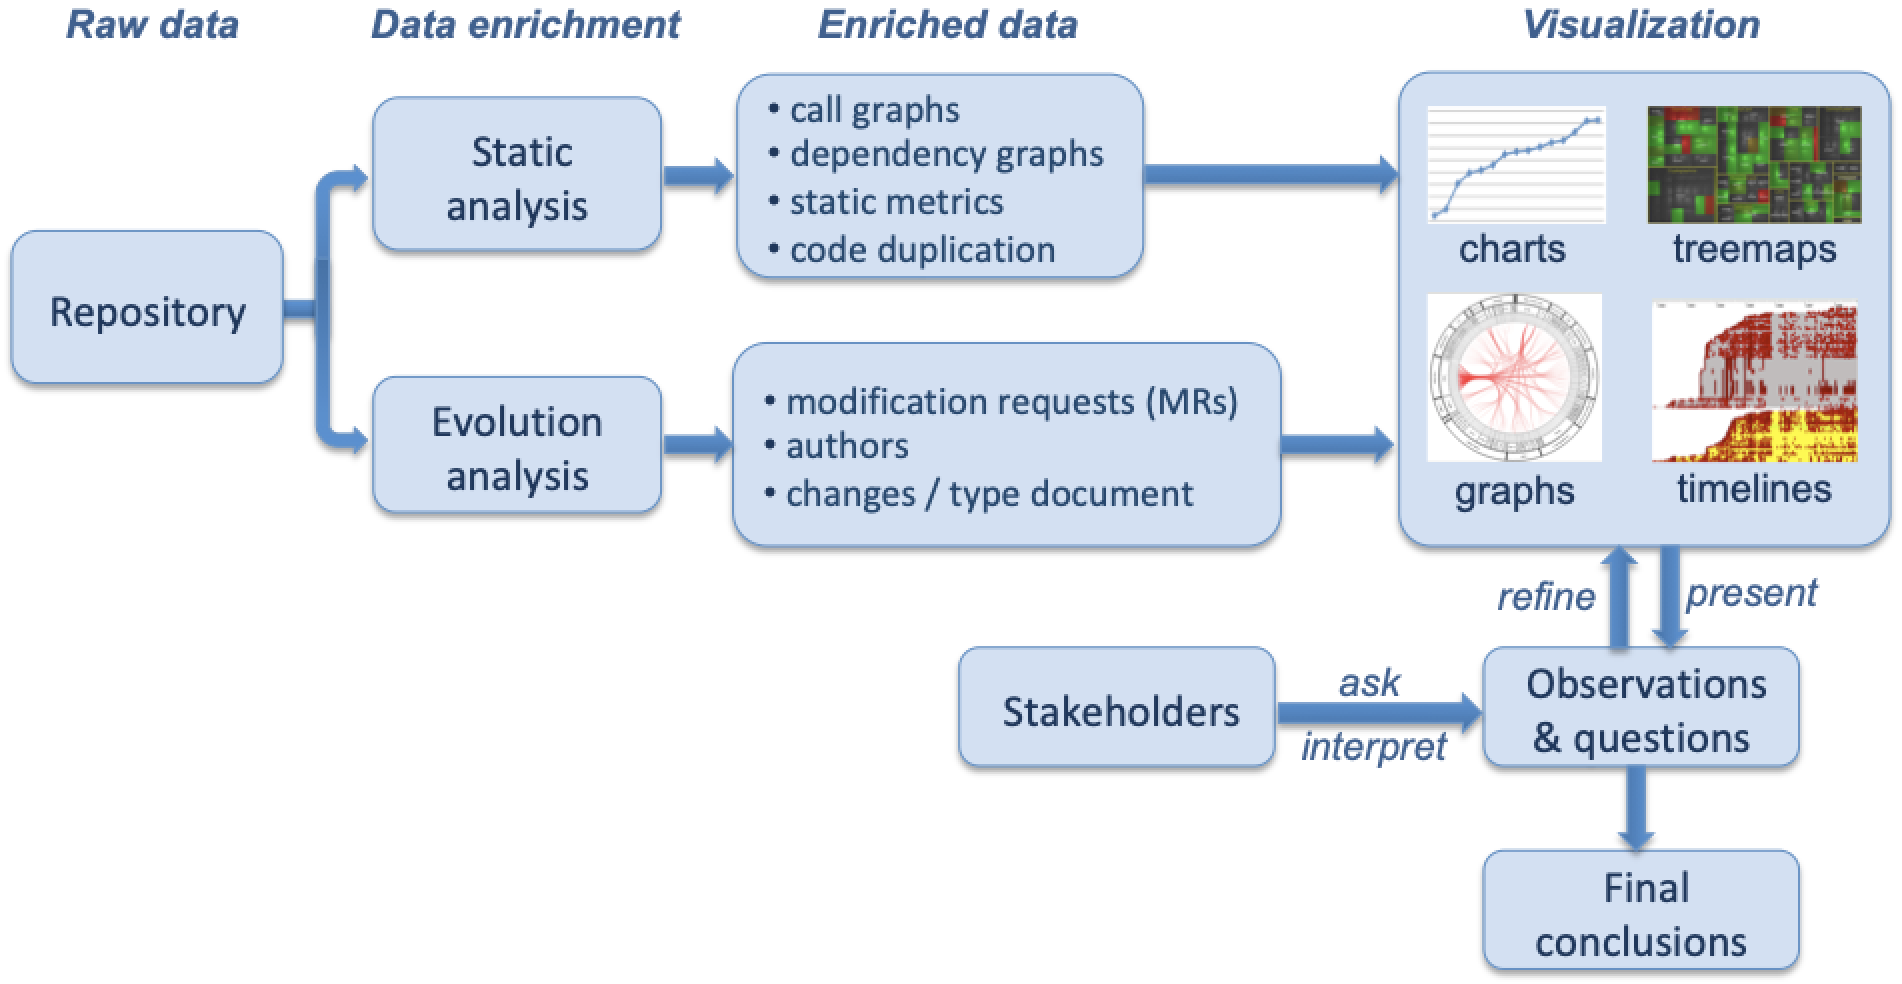
- the software repository is the only source of data
- we mined the repository using both static analysis and evolution analysis
- using the above, we extract a rich set of artifacts (call/dependency graphs, code quality/duplication metrics, modification requests (MRs), code authors, and actual commits)
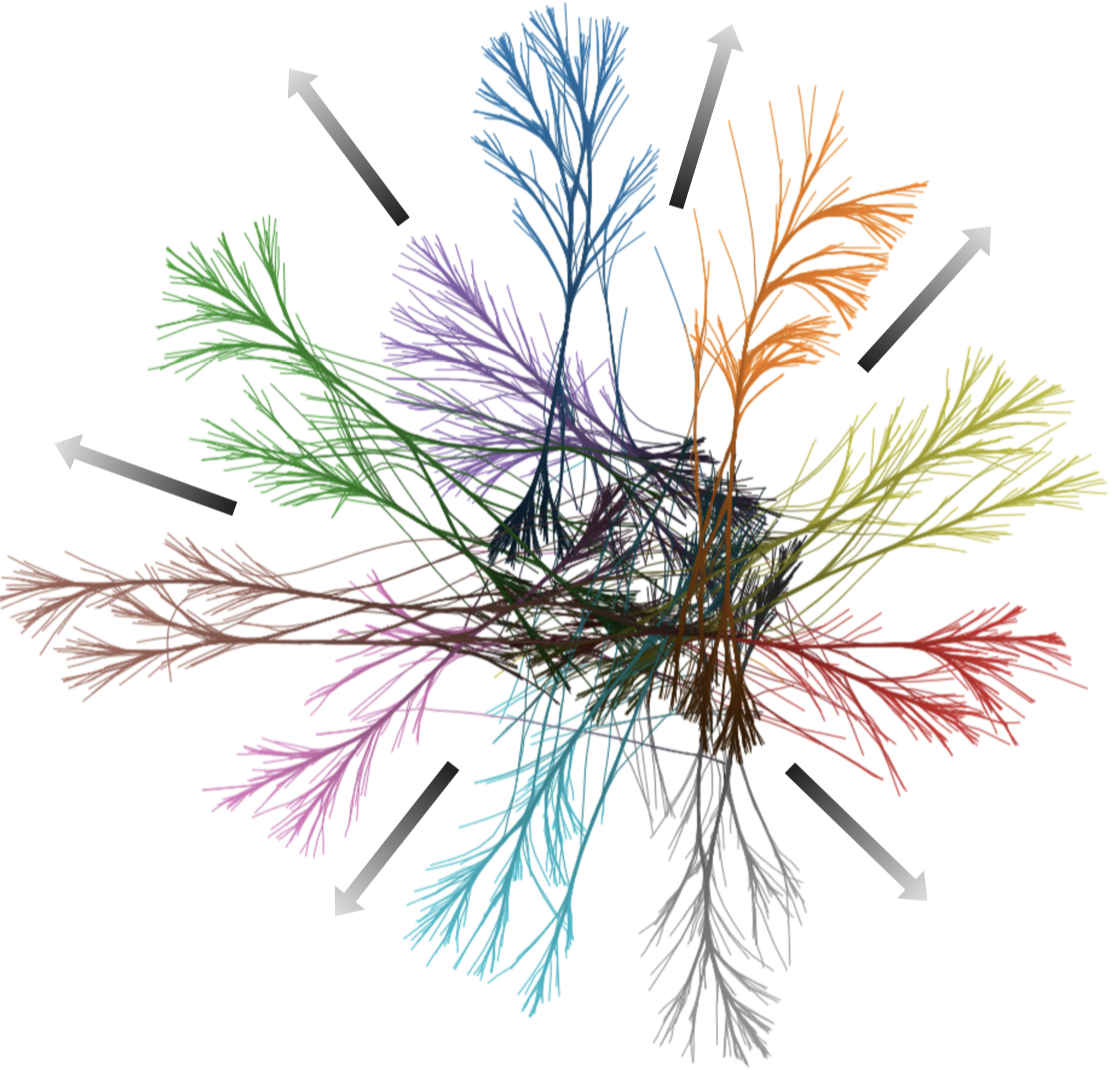
- we visually explore these artifacts using several linked views (charts, treemaps, bundled graphs, and timelines)
- from these views, we form initial hypotheses
- we share these with the product team
- the product team refines and/or (in)validates them
- we repeat the cycle using additional data and views until final conclusions are drawn
Tooling
We used the following software analysis-and-visualization tools:
- SolidFX for the static analysis of the C source code
- SolidTA for the evolution analysis of the repository
- the DuDe code duplication detector
Insight 1: Why is development taking so long?
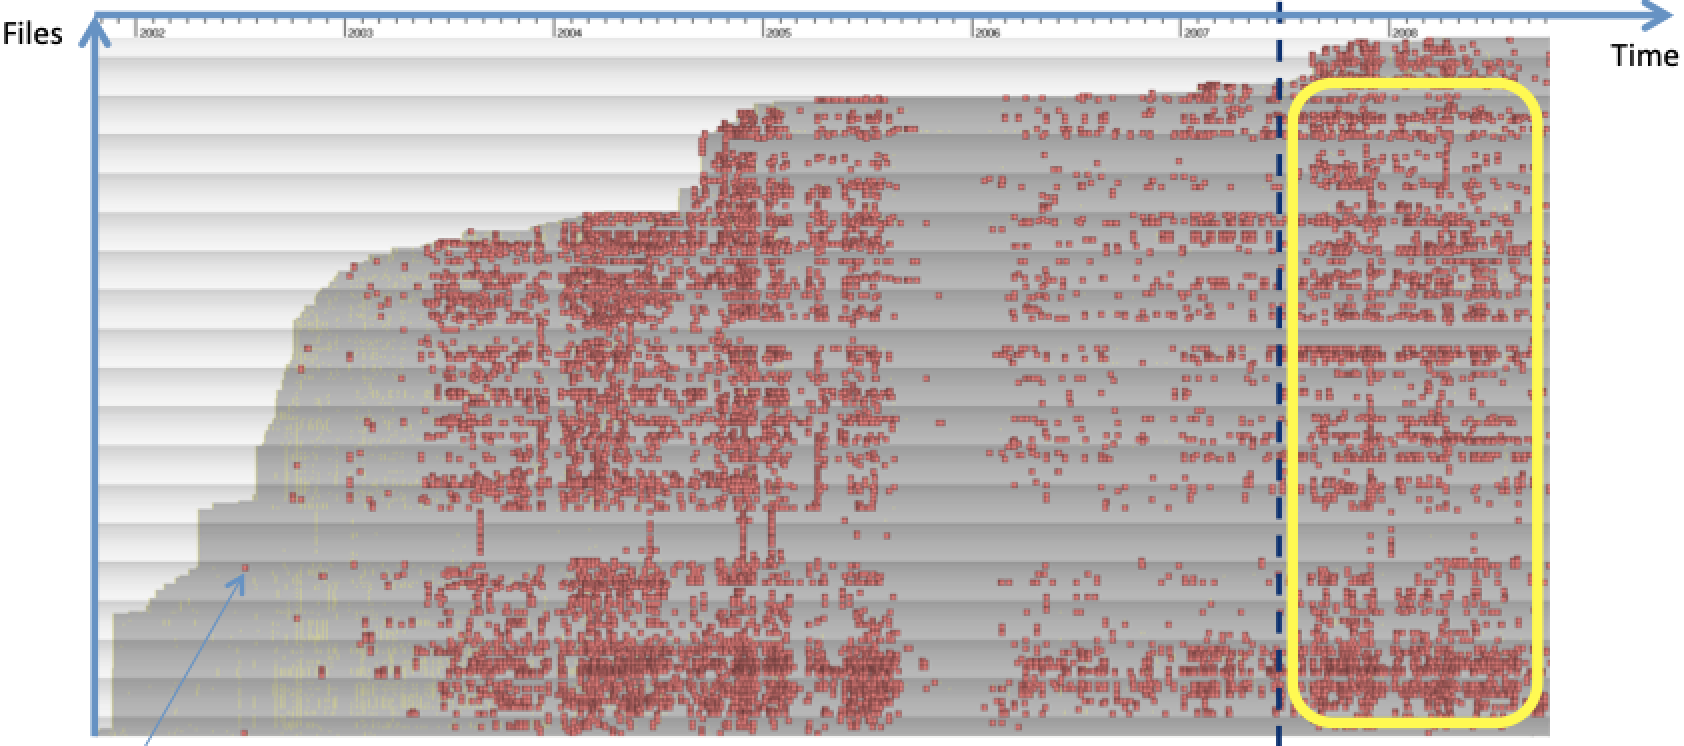
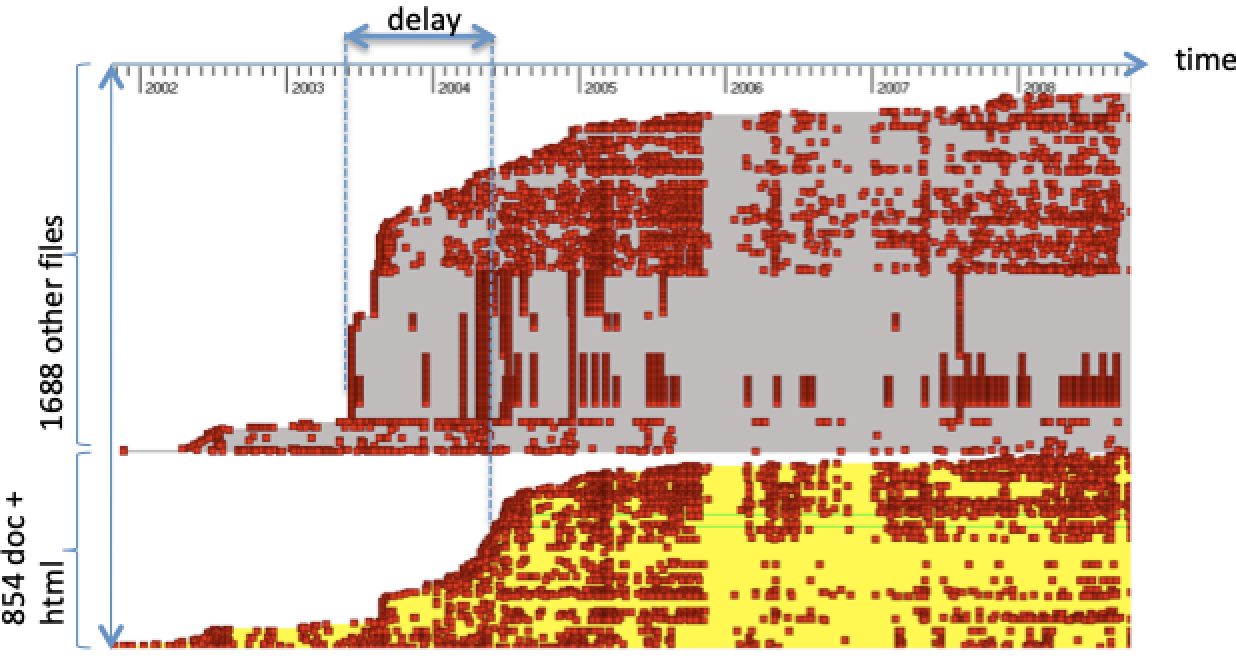
The image below shows an evolution timeline of a representative subset of all files over the entire project duration. Each file is a horizontal pixel line. Red dots are MR-related commits. Older files are at the bottom. From this image, we see that recent activity strongly affects old files. Hence old MRs seem to stay open very long!
Insight 2: Who is responsible for the delays?
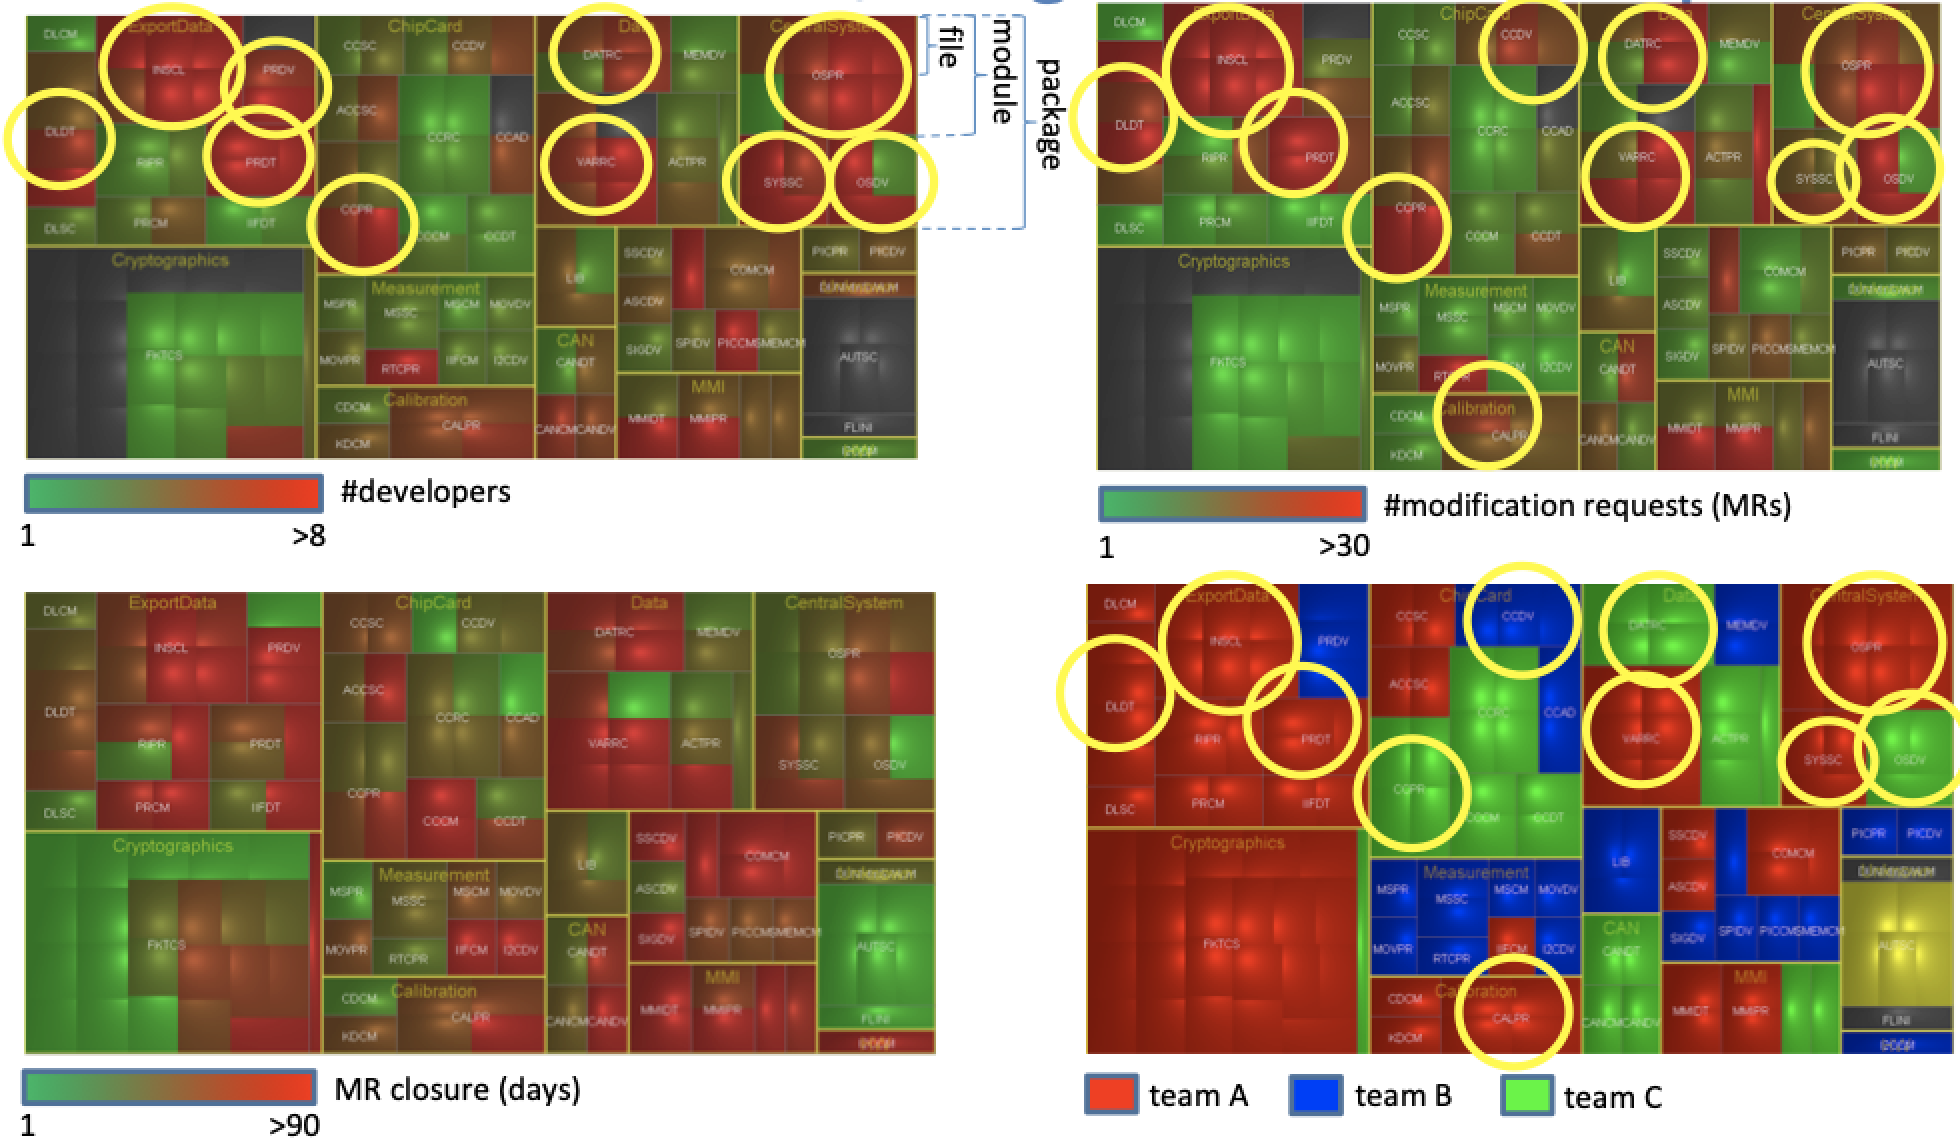
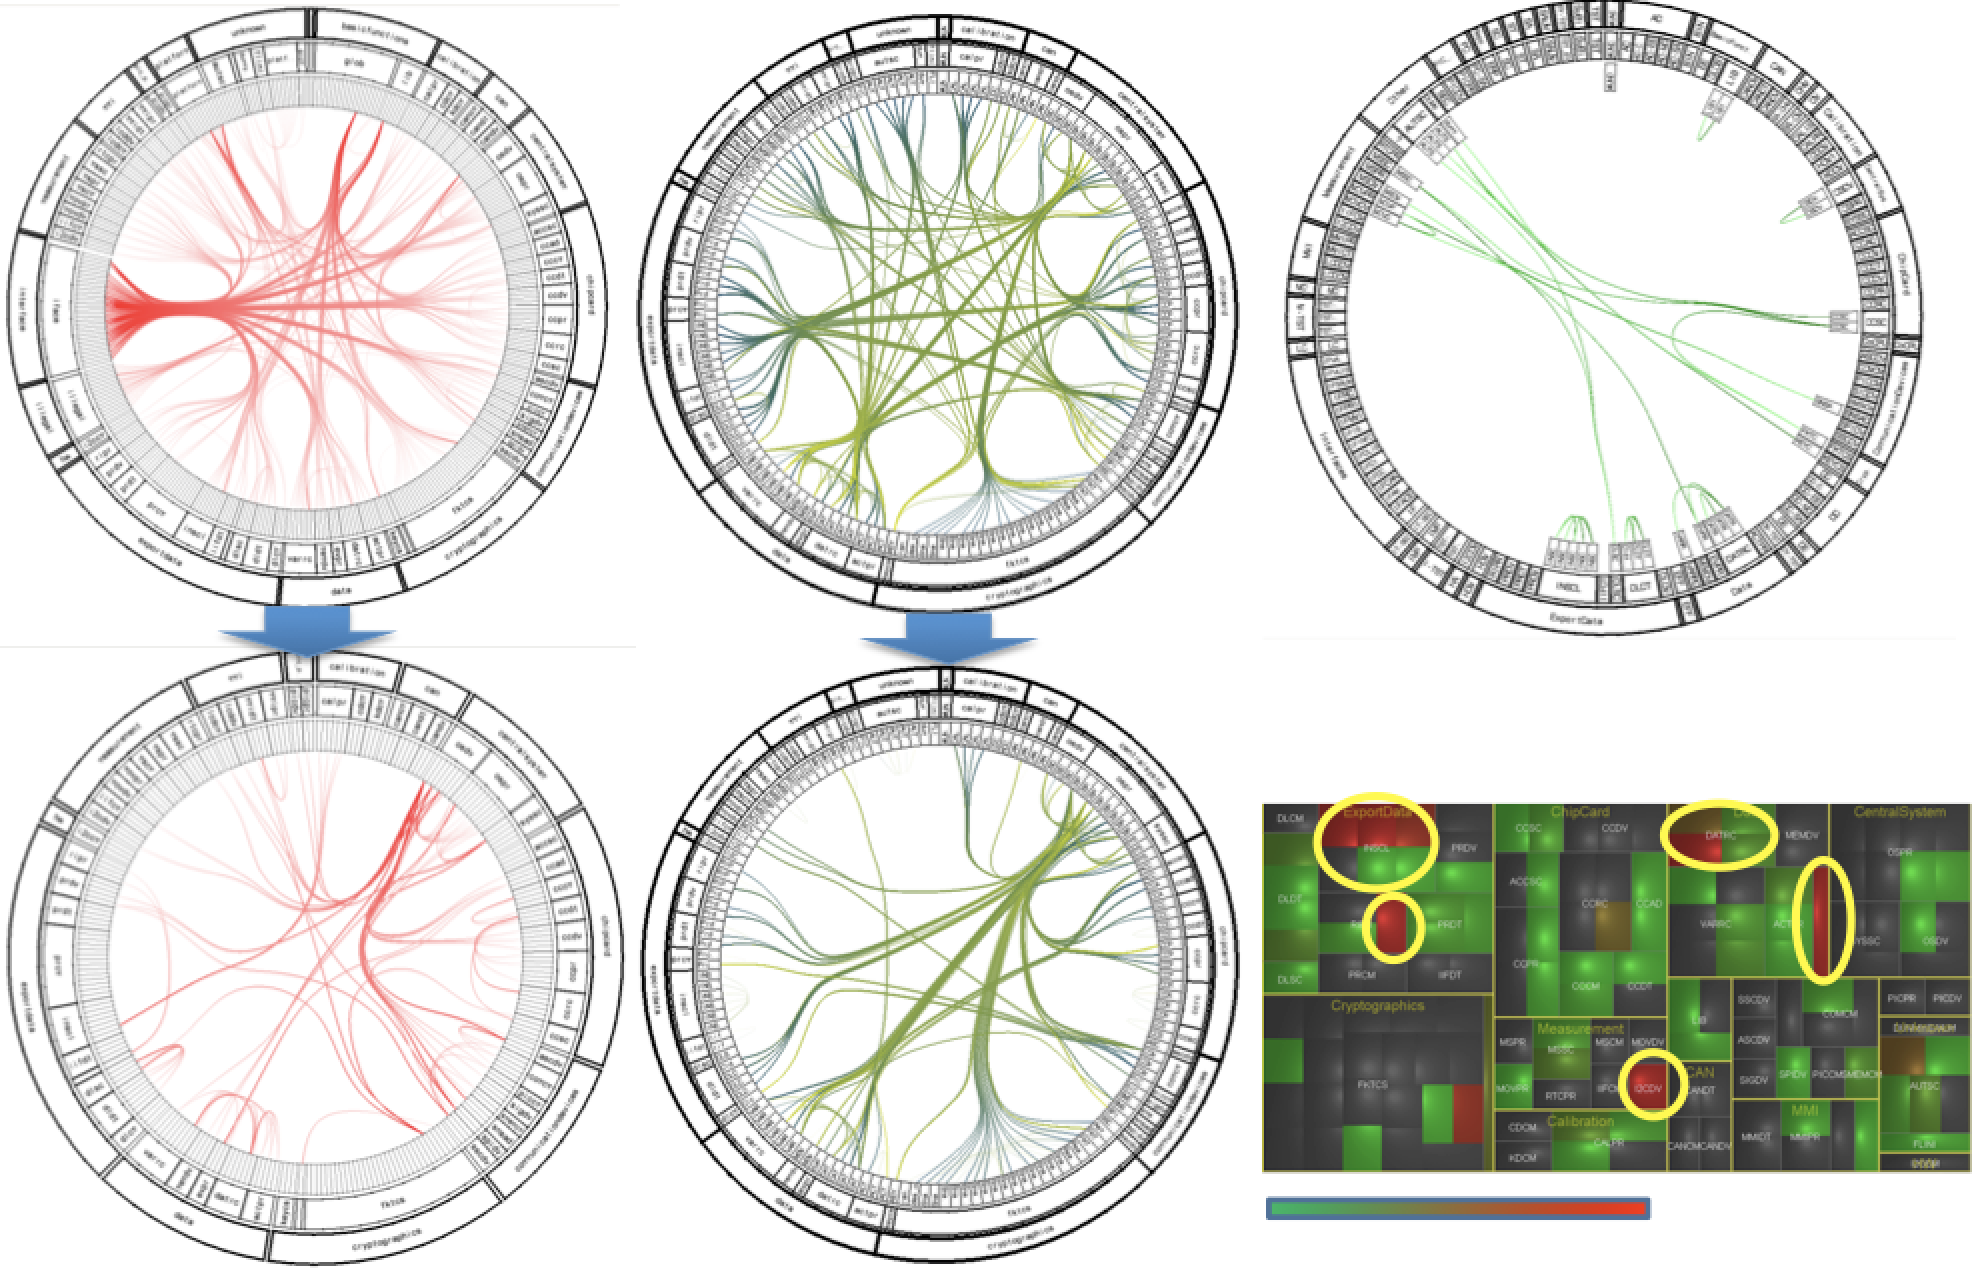
The image below shows four treemaps depicting the code structure annotated by number of developers, number of MRs, average duration until MR closure, and team identity. Correlating these images, we see that a large part of the code containing many long open-standing MRs is assigned to the red team. Upon seeing this, the project managers noted that they had serious communication problems with this offshore team!
Insight 3: What is the code quality?
The various images below show several aspects of the code quality (modularity, architectural violations, and code duplication). Analyzing these, we conclude that the code is in general of good quality. For details, see the paper below.
Insight 4: How to fix the situation?
So far, we conclude that the code is in a relatively good state, the main problem being that considerable and complex code was assigned to a suboptimal team. Can we speed up development by re-assigning this code to another team? For this, we must see if the code is well documented. The image below shows the evolution of the code (gray, at top) in parallel with that of the documentation (yellow, below). Red dots indicate changes. We see that both code and documentation are well maintained, the latter with a small delay compared to the former. Hence, we conclude that the code is well documented, thus easy to take over.
Outcome
Using our analysis, the project management re-assigned code ownership. Development rapidly picked up and the product was successfully finalized in less than a year. Happy end!
Publications
Case Study: Visual Analytics in Software Product Assessments L. Voinea, A. Telea. Proc. IEEE VISSOFT 2009