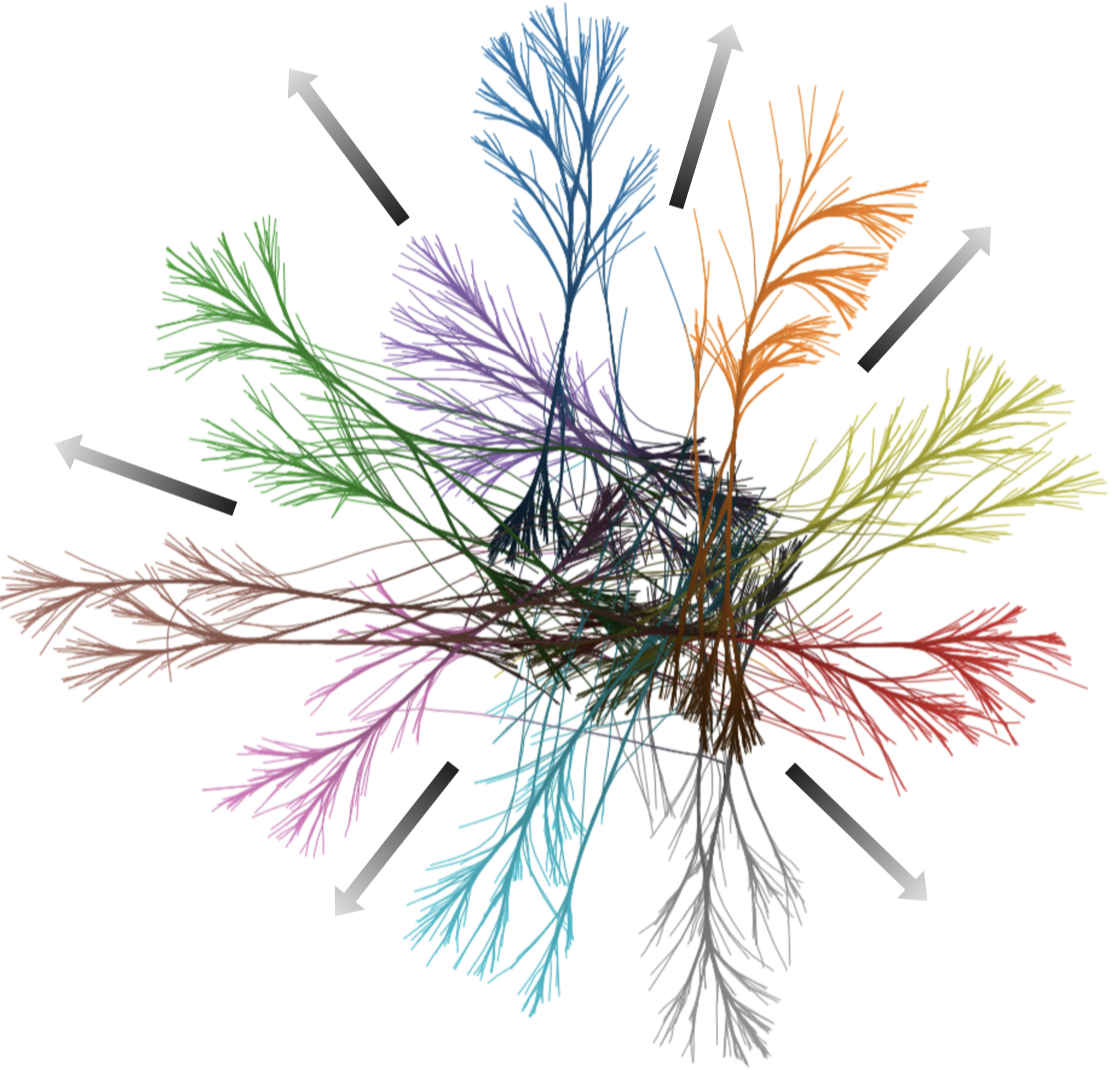
Skeleton Principal Graphs
Scatterplots are among the best-known, and most-used, tool to examine multidimensional data. Scatterplot matrices group several such scatterplots to visualize multiple dimension pairs. A problem in this sense is that showing too many scatterplots to a user can be burdening. The user would like to see a summarization, or simplified version, of the scatterplots. How to compute this?
Principal graphs are an established tool for this. Simply put, these reduce a scatterplot to a set of curves that describe locally how the scatterplot points are spread. By reducing 2D scatterplots to 1D curves, we minimize the amount of data to be shown by the user, but hopefully retain the same information (scatterplot size, orientation, number of clusters, size/thickness of clusters, etc).
Computing principal graphs is however expensive and delicate (parameter tuning). Can we do better?
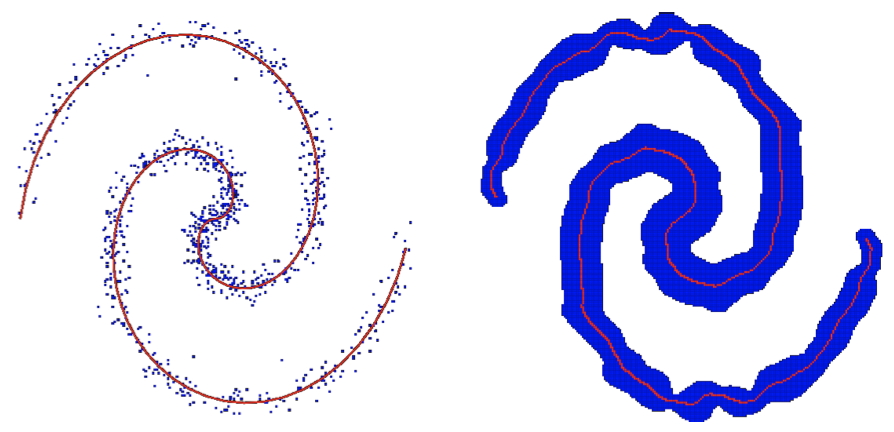
Skeletons enter to the rescue by a simple idea: We obtain a compact 2D binary shape by convolving the scatterplot with a Gaussian kernel, and then compute the 2D skeleton of that shape. The image below shows a scatterplot with a principal curve computed by classical methods (left); and the binary shape obtained from blurring (blue, right) and its corresponding skeleton (red, right). We can see that the skeleton almost perfectly matches the principal curve!
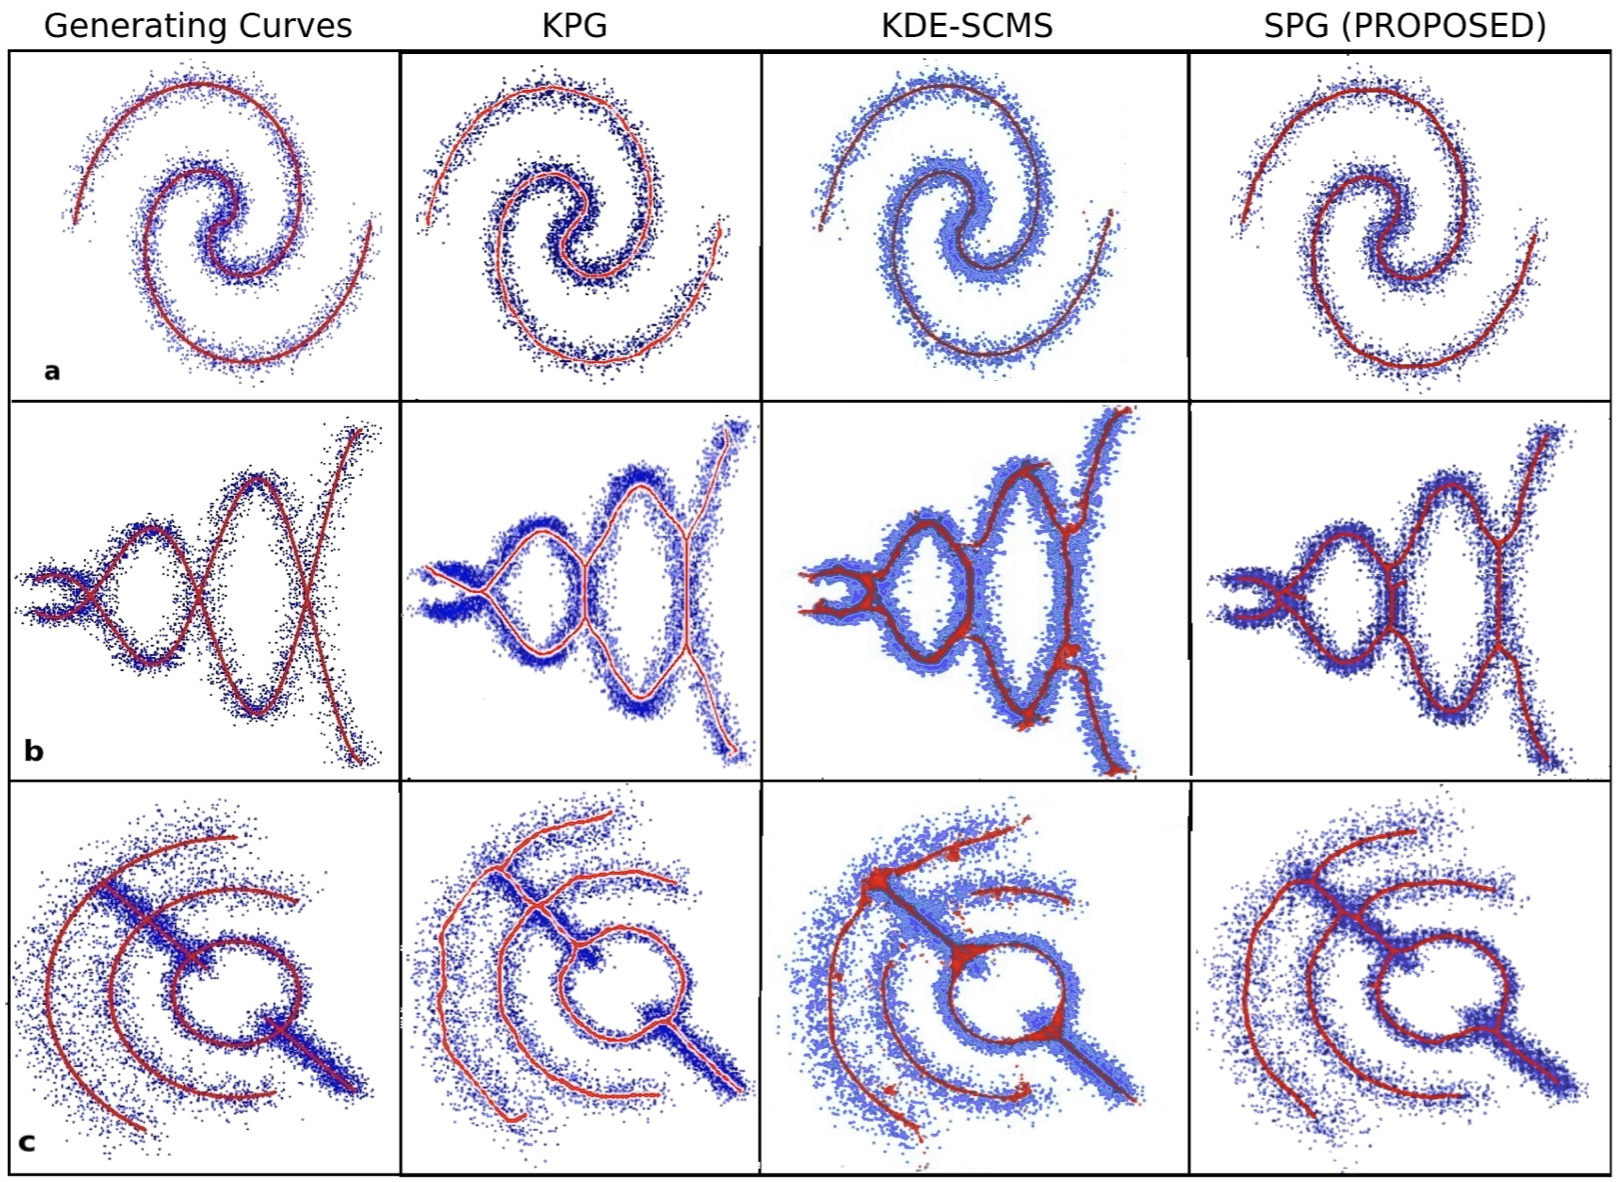
The image below proves our method: We generated several scatterplots from known distributions along the curves indicated in the left column. For each of these scatterplots, we show the principal curves computed with two classical methods (KPG, KDE-SCMS). Our skeleton-based principal curves (right column) are very similar to the ground-truth curves, and also smoother and simpler than those from KPG and KDE-SCMS.
Implementation
Our method is generic (can handle any scatterplots), robust (to small variations or noise in the plot), has no complex parameters, and is computationally efficient (computing the skeleton of a plot takes milliseconds on the GPU). All these are thanks to the underlying skeleton computation method.
References
Scatterplot Summarization by Constructing Fast and Robust Principal Graphs from Skeletons J. Matute, M. Fischer, A. Telea, L. Linsen. Proc. IEEE PacificVis 2019